Modern enterprises are continuously evolving their analytics landscape to keep pace with expanding data volumes and dynamic business requirements. Traditional reporting platforms like Oracle Analytics Server (OAS), while effective in structured reporting, often lack the agility and scalability required for today’s analytics-driven decision making.
This blog presents a structured migration approach from OAS to Databricks, highlighting how ERP data from Oracle is integrated into a lakehouse architecture and transformed into powerful, interactive dashboards. From connection setup and catalog creation to schema organization and dashboard development, this journey showcases how organizations can modernize their reporting ecosystem using Databricks.
Business Impact
The migration from OAS to Databricks not only modernizes the reporting infrastructure but also enhances enterprise agility. By consolidating ERP analytics within a lakehouse architecture, the organization benefits from improved scalability, optimized performance, stronger governance, and reduced operational complexity. This transformation positions the analytics platform to support advanced use cases and long-term digital growth initiatives.
Here is the overview of the complete process in the blog:
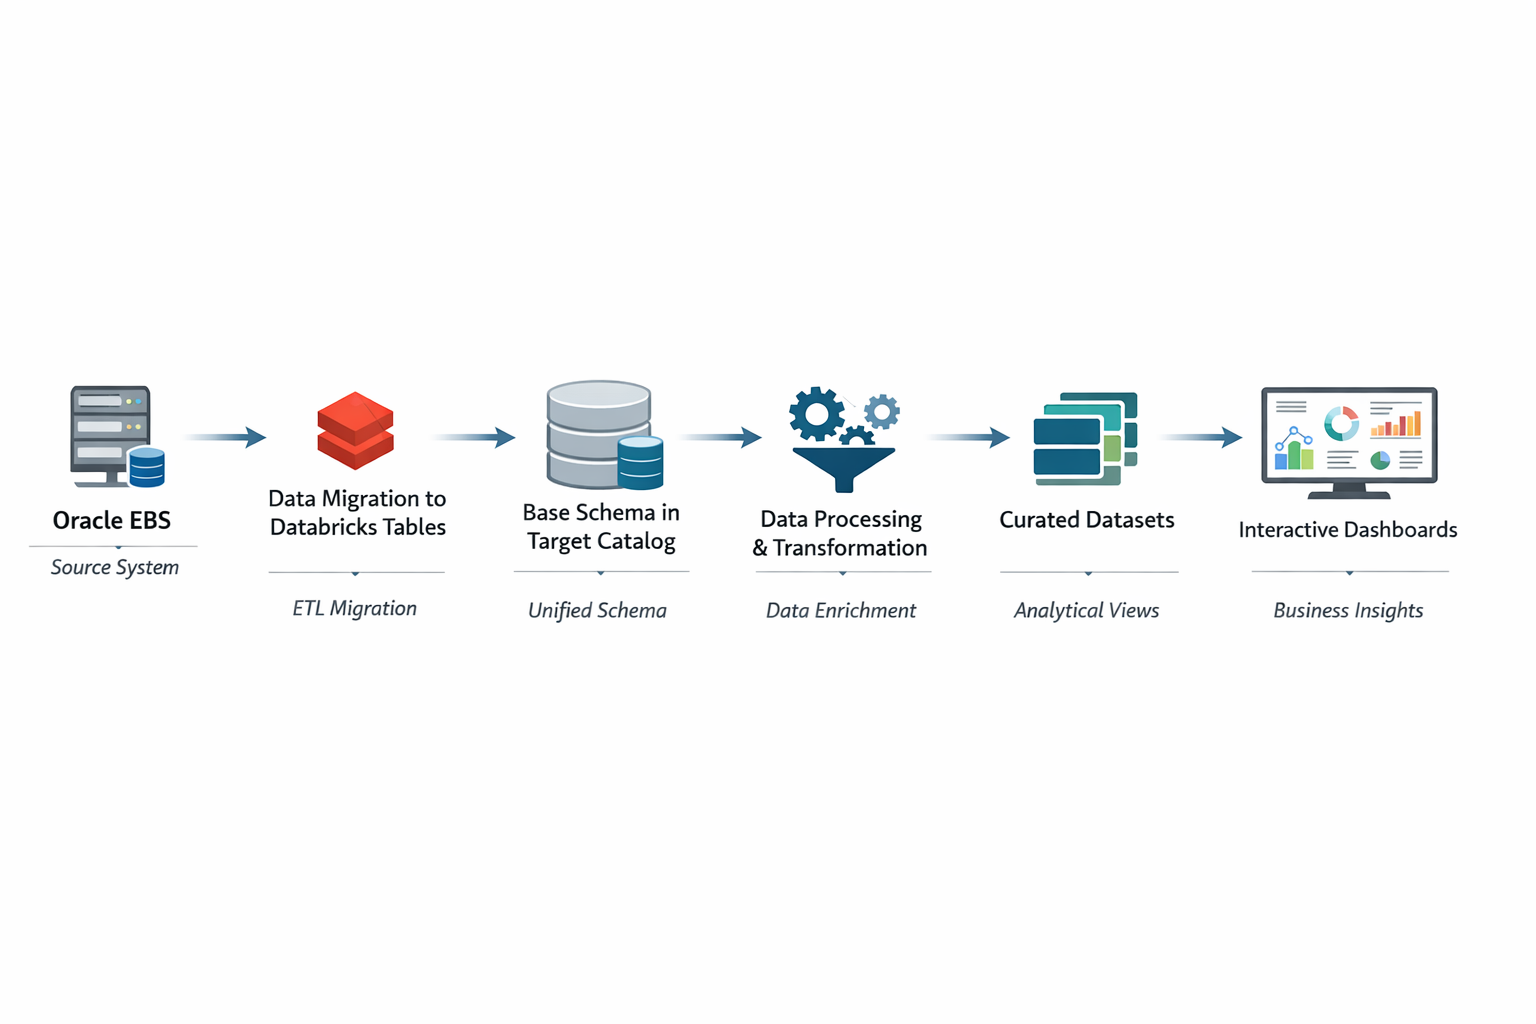
The following sections outline the structured steps involved in the migration process, from establishing the connection to building the final dashboards.
Connection From Databricks to OAS:
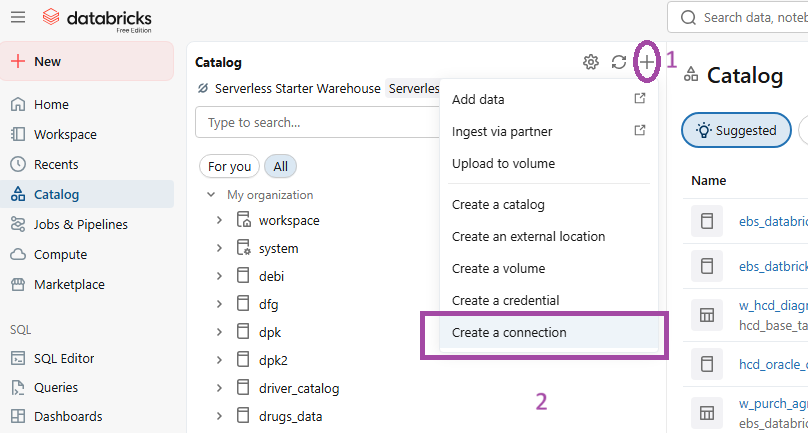
FIG (1)
In fig (1) under the catalog section we go for ‘Create a connection’ to establish a connection between the server’s database and Databricks.
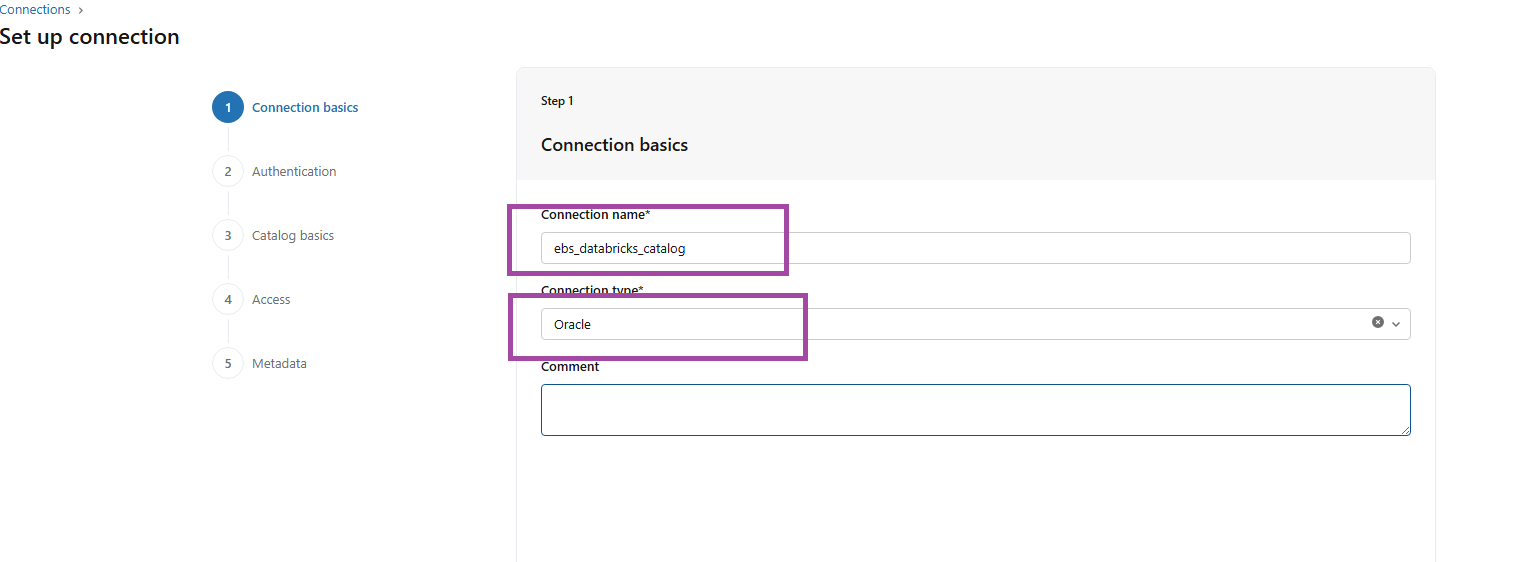
FIG (2)
Fig (2) shows the connection basics by providing the required Connection name and Connection type.
Here the connection name is ‘ebs_Databricks_catalog’ and type is ‘Oracle’.
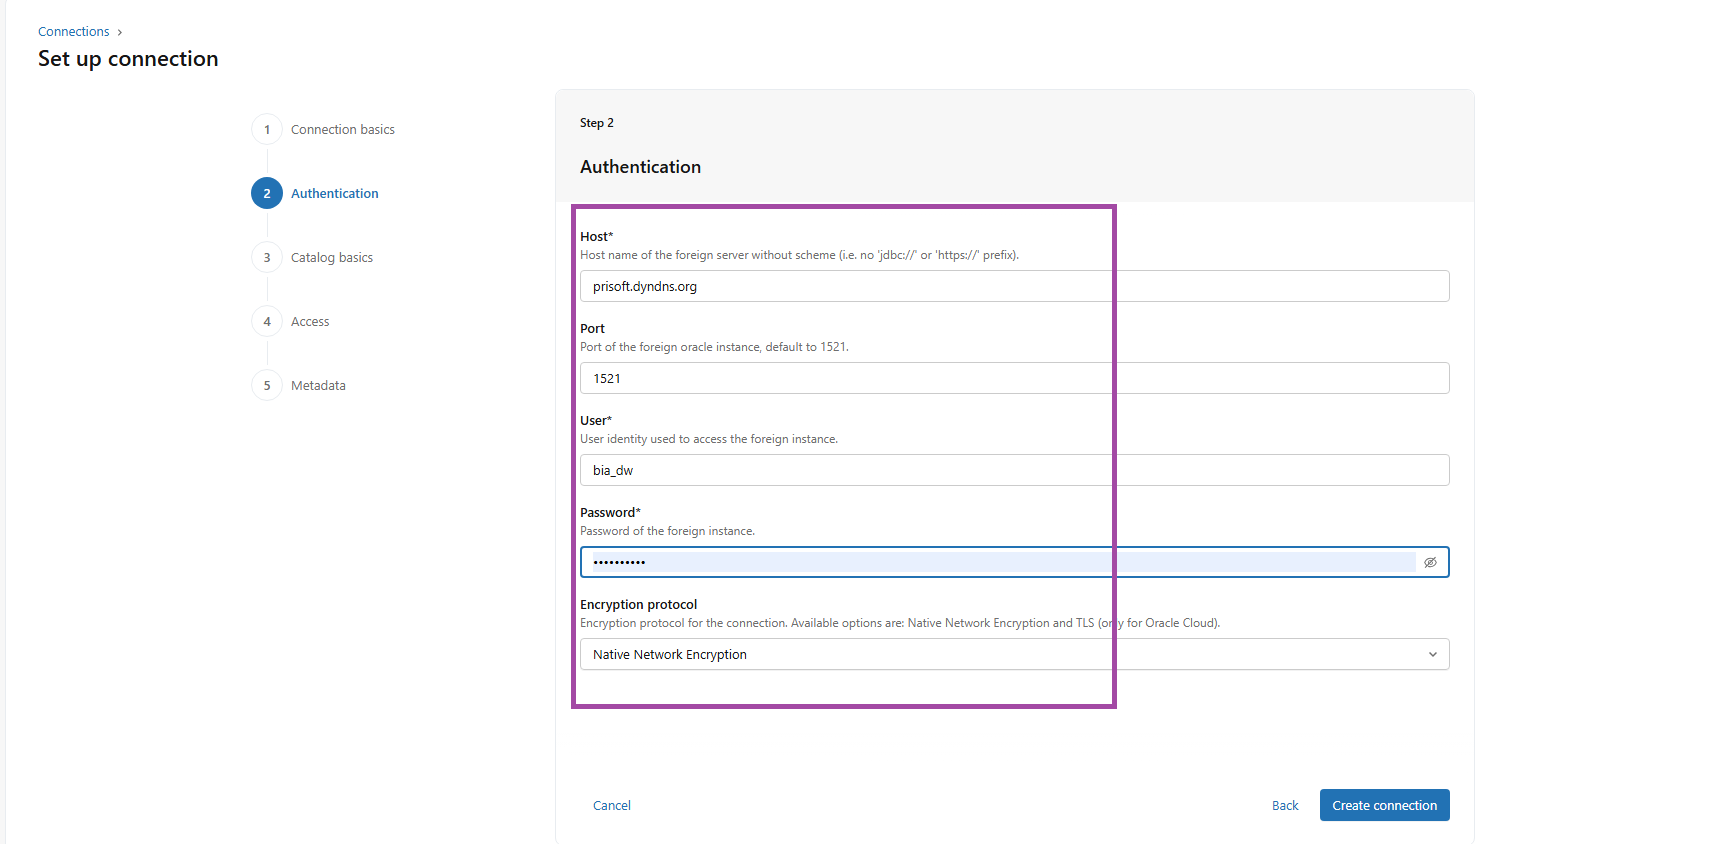
FIG (3)
The above fig (3) shows the details required for the connection like Host, Port number, User name, Password and the Encryption protocol.
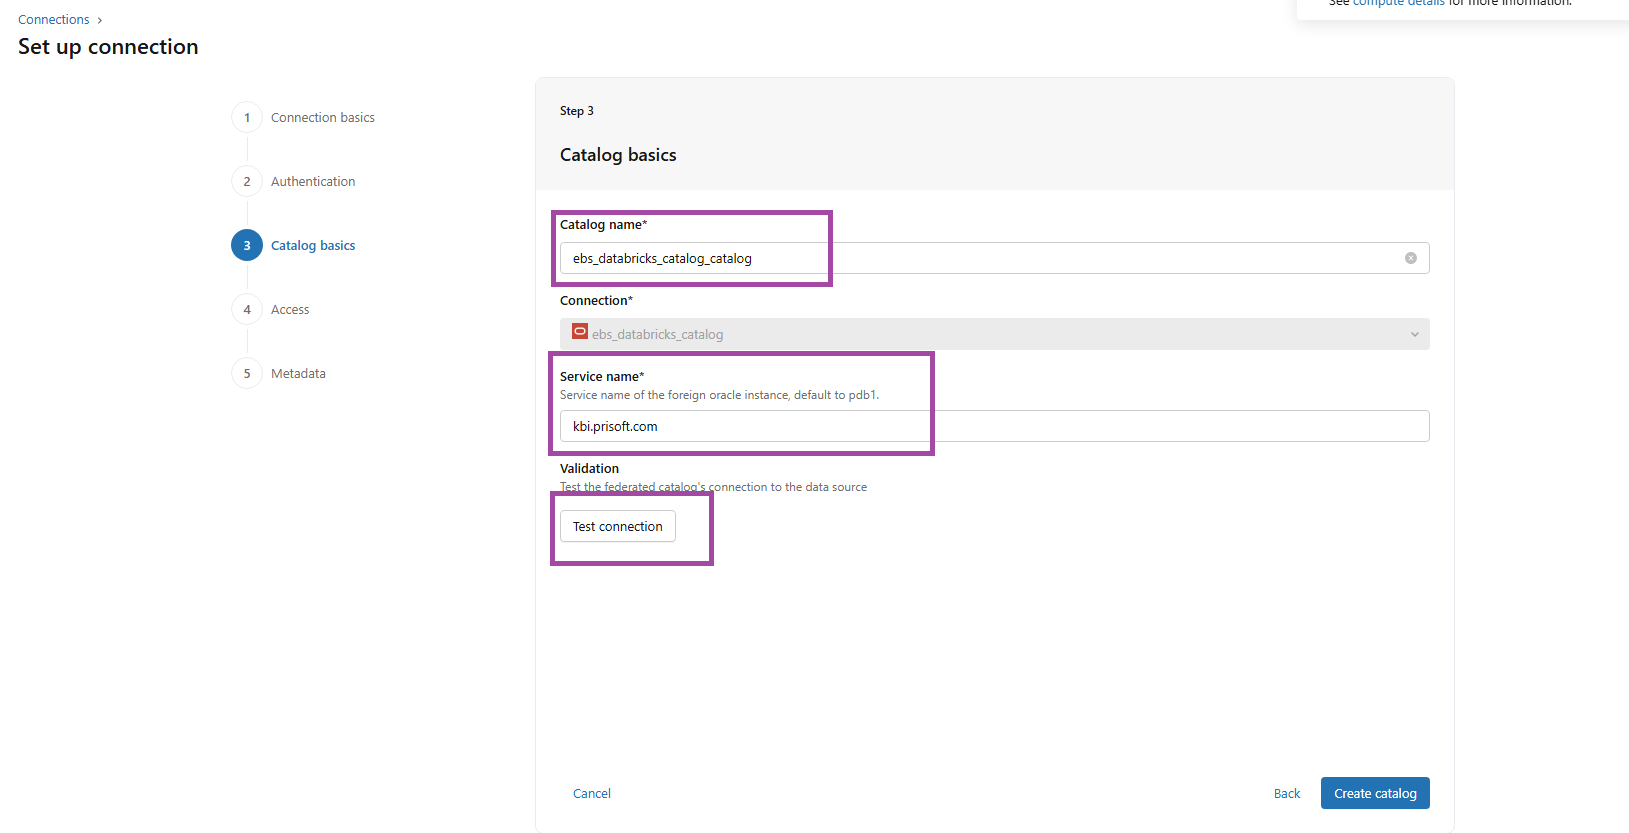
FIG (4)
The Catalog basics need to be filled with the catalog name you prefer, the service name and for the validation you can use ‘Test connection’, If the test connection is successful, proceed with catalog creation. If it fails, verify and update the credentials accordingly. Here the Catalog name is ‘ebs_Databricks_catalog_catalog’.
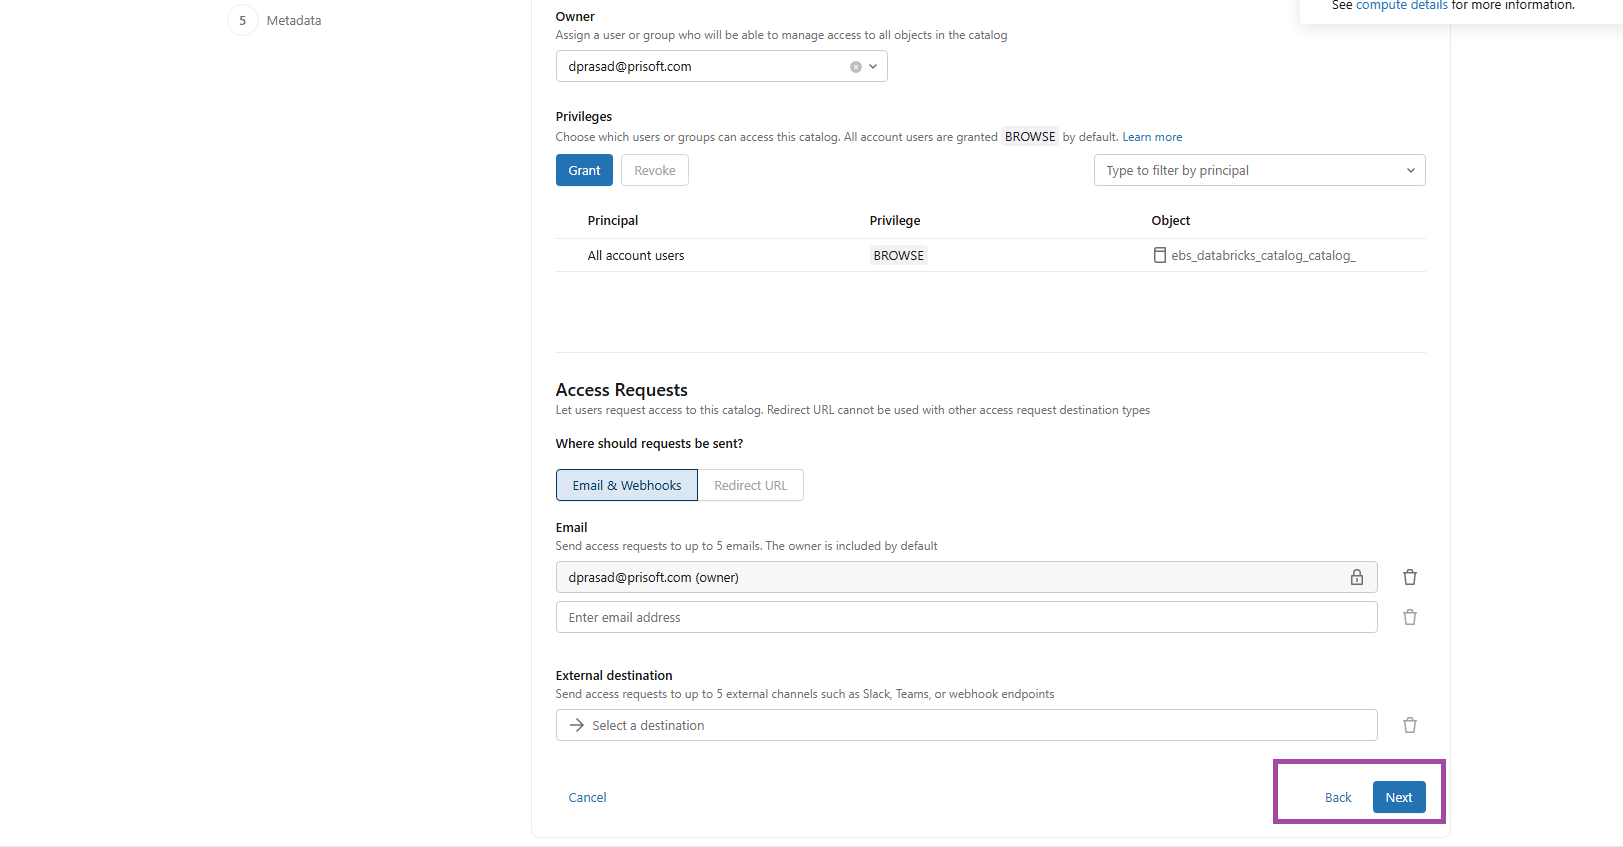
FIG (5)
Access permissions were configured according to business requirements, ensuring controlled visibility and governance of the catalog, as shown in Fig (5).
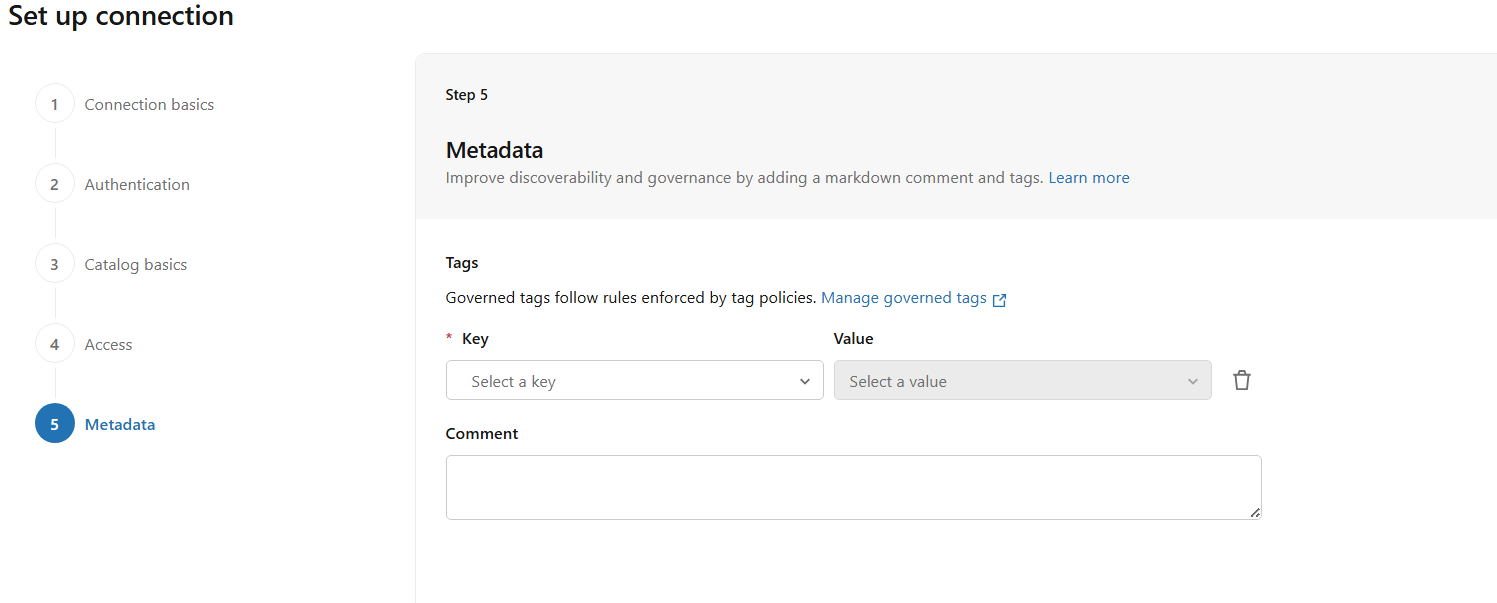
FIG (6)
In Fig (6), metadata can be configured by defining key–value pairs based on governance requirements. This step is optional and can be left blank if not required.
Hence the connection and catalog has been successfully created.

FIG (7)
Fig (7) shows the schema ‘bia_dw’ has been successfully migrated to the ebs_Databricks_catalog in Databricks.
Migration to the target Destination:
It is not recommended to operate directly on source tables. Instead, best practice is to migrate them into a dedicated target schema to ensure isolation, governance, and controlled transformations. 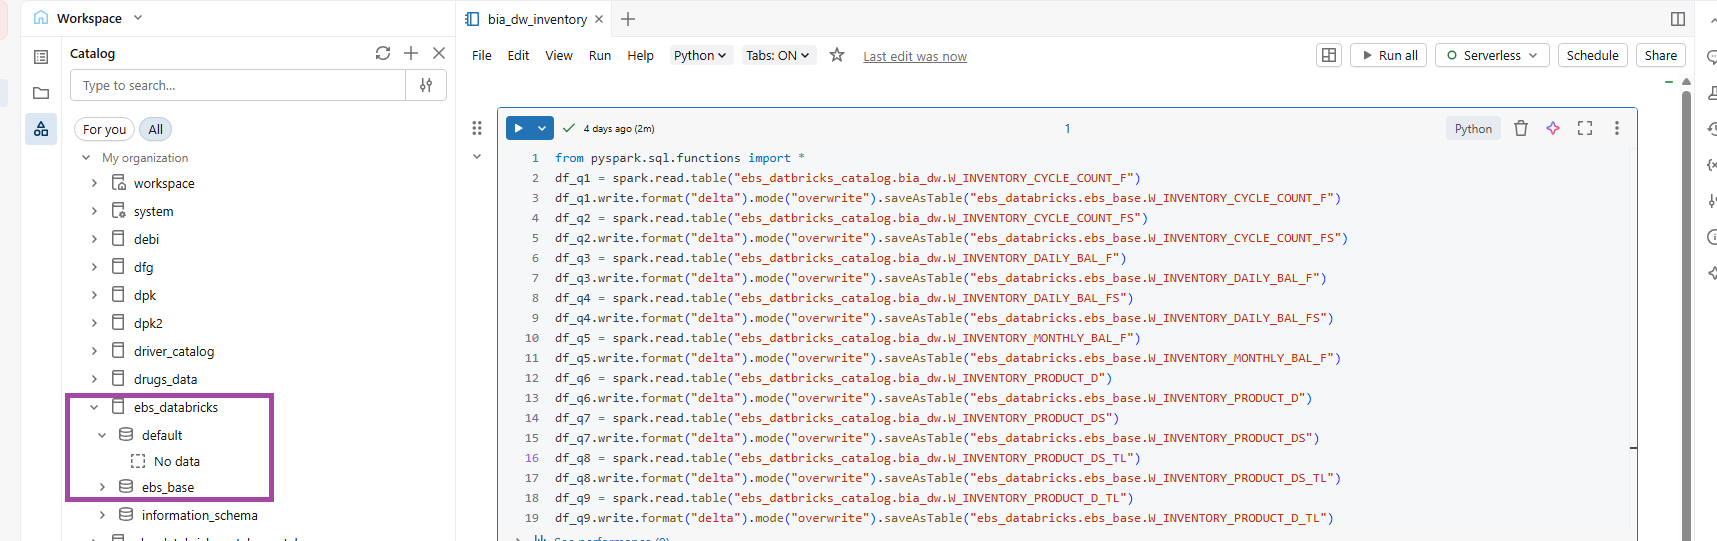
FIG (8.a)
Migrating the INVENTORY tables from ‘ebs_Databricks_catalog.bia_dw’ to ‘ebs_Databricks_catalog.ebs_base’ by read and write method using Pyspark, the path is in format ‘catalog.schema’.
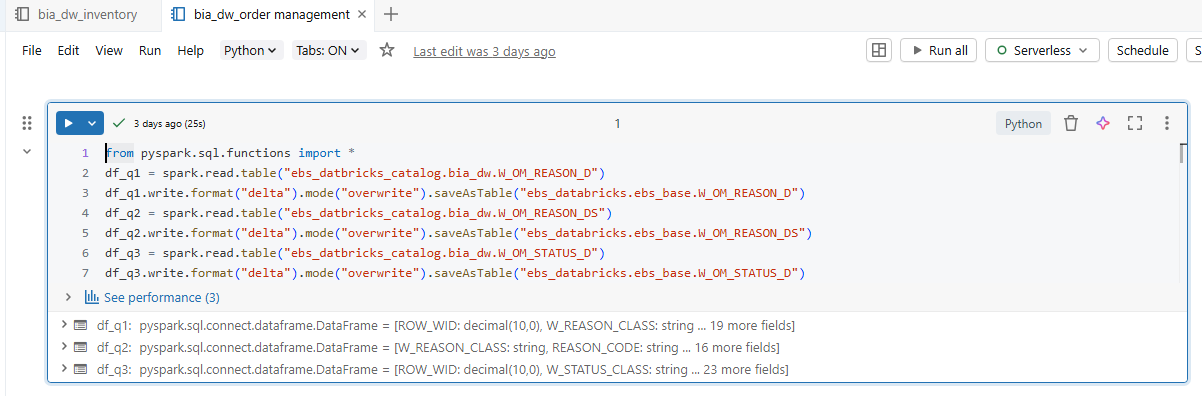
FIG (8.b)
Migrating the ORDER MANAGEMENT tables from ‘ebs_Databricks_catalog.bia_dw’ to ‘ebs_Databricks_catalog.ebs_base’.
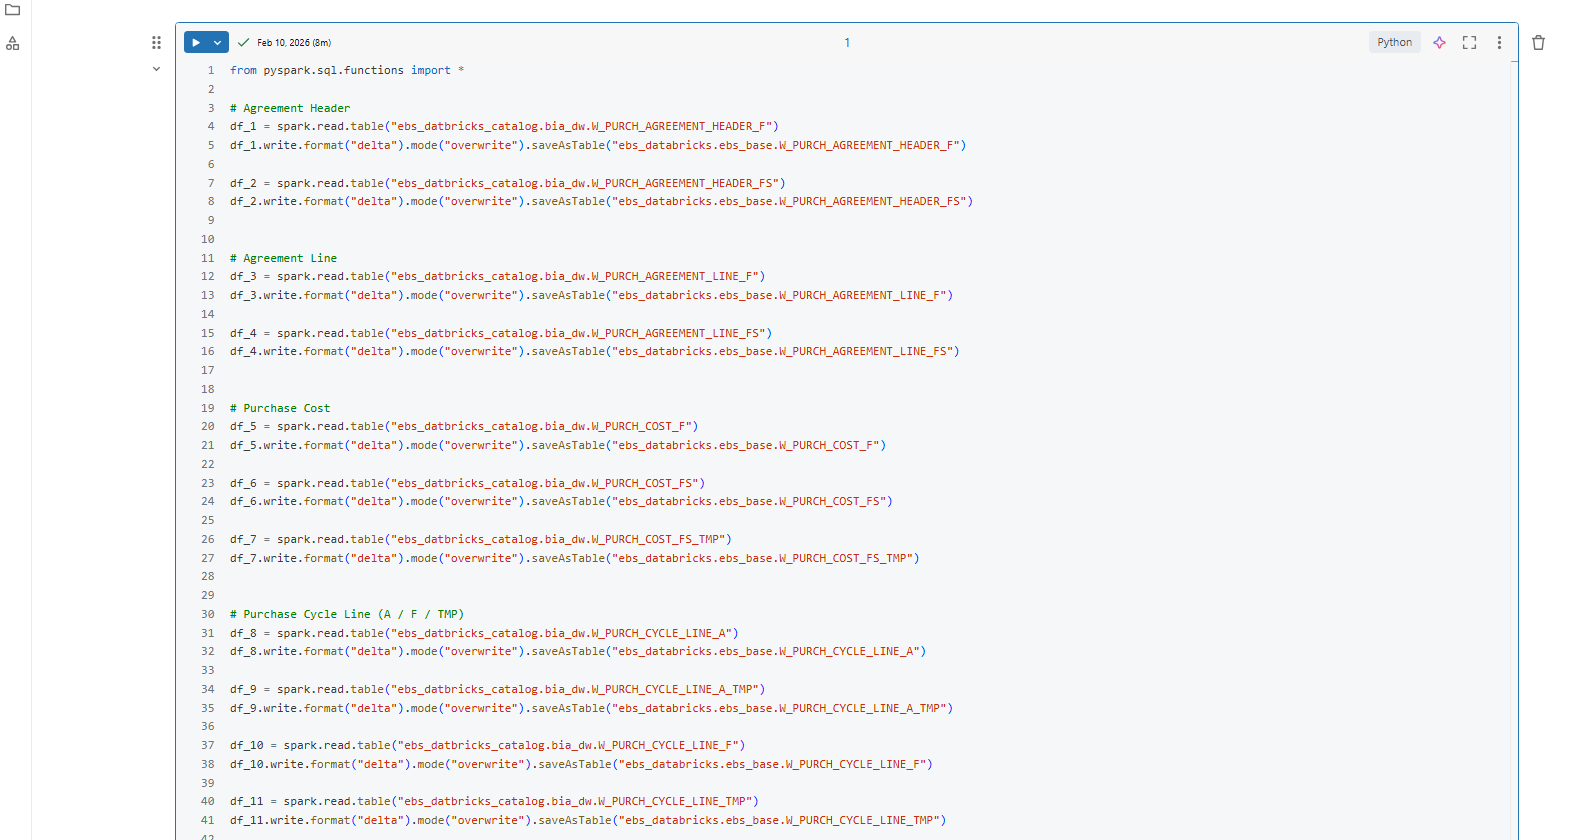
FIG (8.c)
Migrating the PURCHASING tables from ‘ebs_Databricks_catalog.bia_dw’ to ‘ebs_Databricks_catalog.ebs_base’.
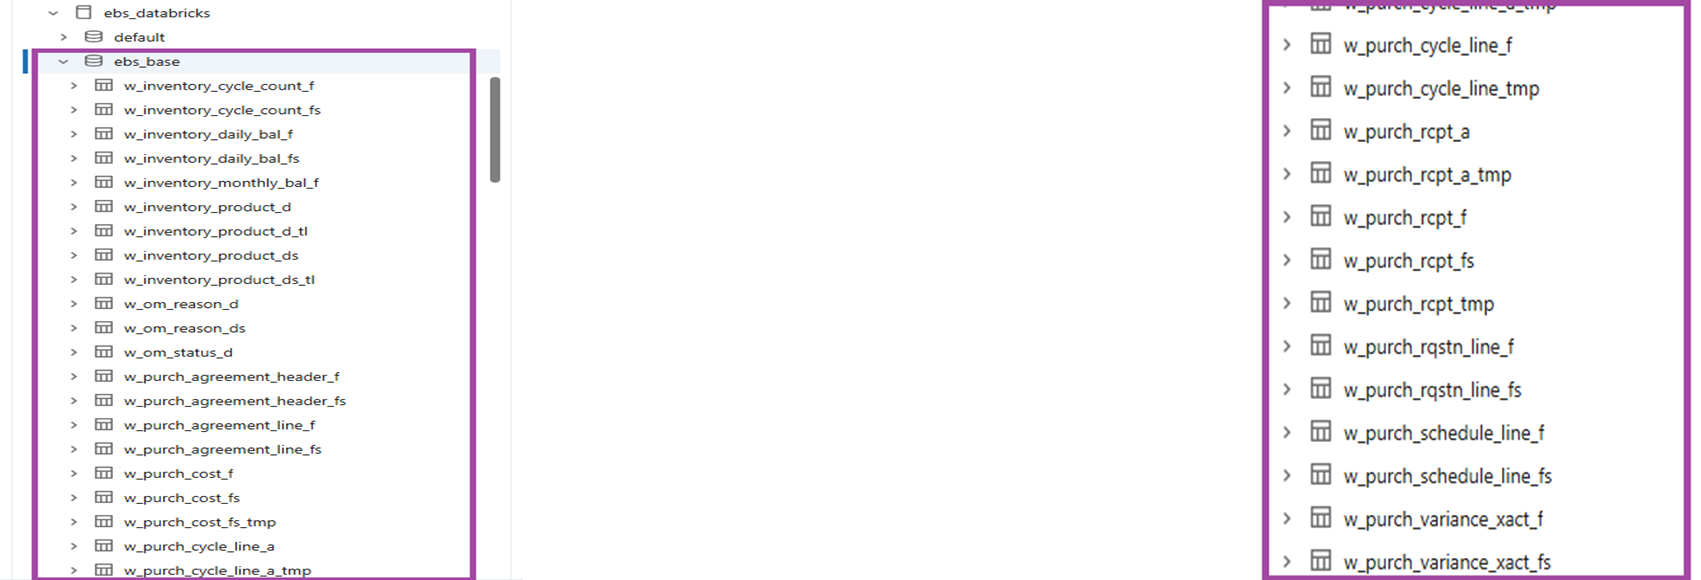
FIG (9)
Fig (9) shows the tables that have been migrated from the bia_dw schema to ebs_base schema.
DASHBOARD CREATION:
Now as the tables has been migrated it’s time to create some insightful visualizations.
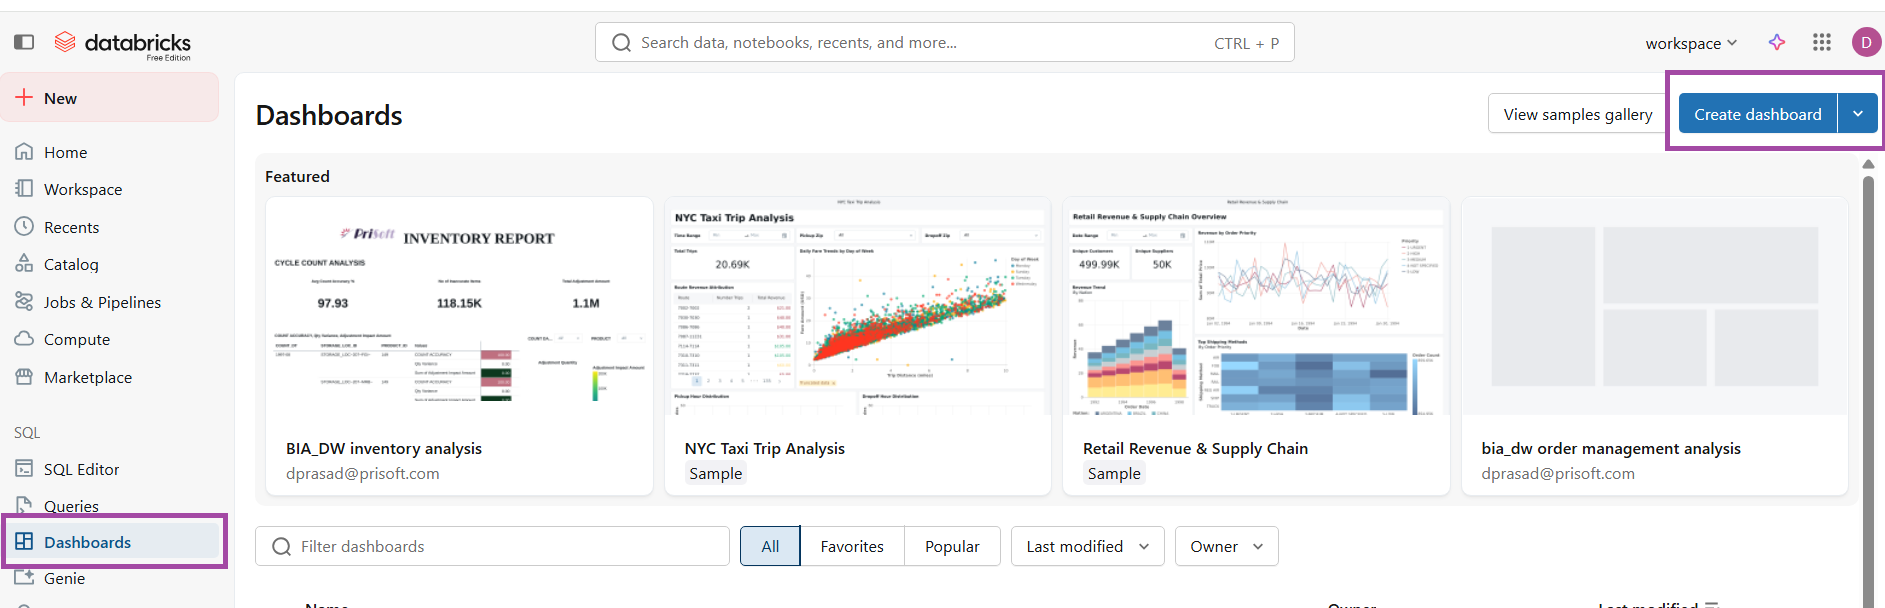
FIG (10)
To create a dashboard click ‘Create dashboard’ under the ‘Dashboard’ navigator.
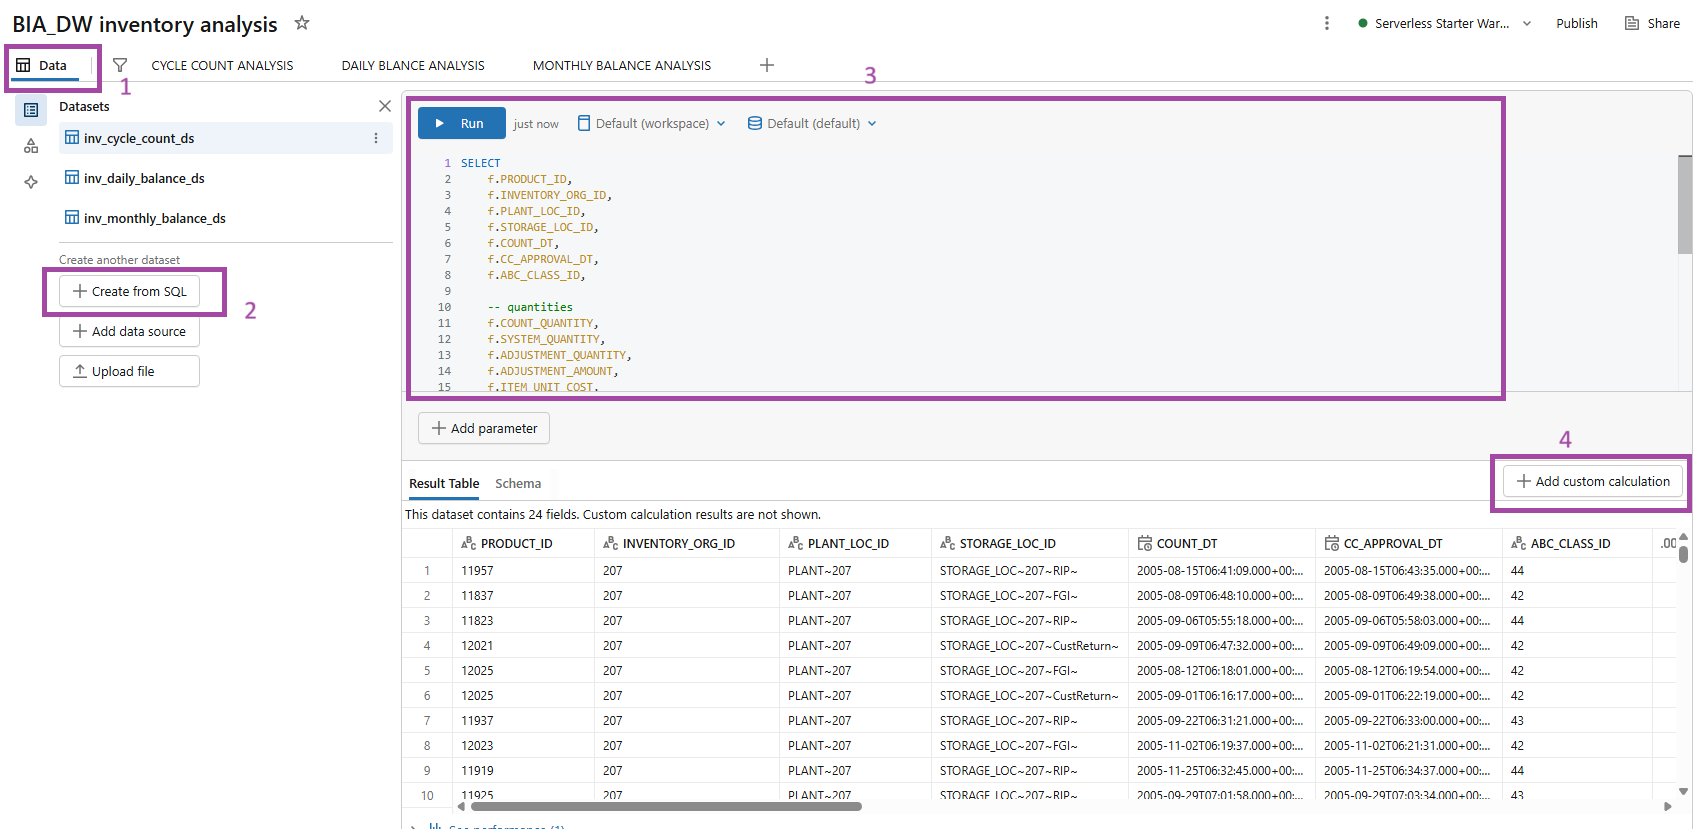
FIG (11)
After creation of dashboard for inventory analysis, create datasets under the ‘Data’ tab and create datasets by ‘+ Create from SQL’ by joining the tables. Here 3 datasets have been created for the analysis.
Effective reports do not rely solely on datasets created from base tables; they also require specific calculations to present accurate and meaningful insights, hence we go for ‘+ Add custom calculations’.
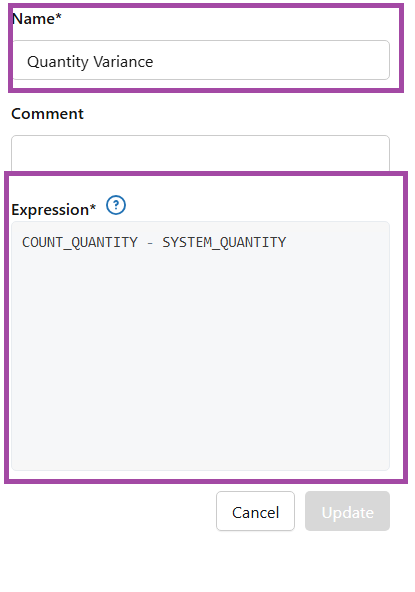
FIG (12)
In custom calculations, each measure must be clearly named and defined using accurate SQL expressions as shown in fig (12)
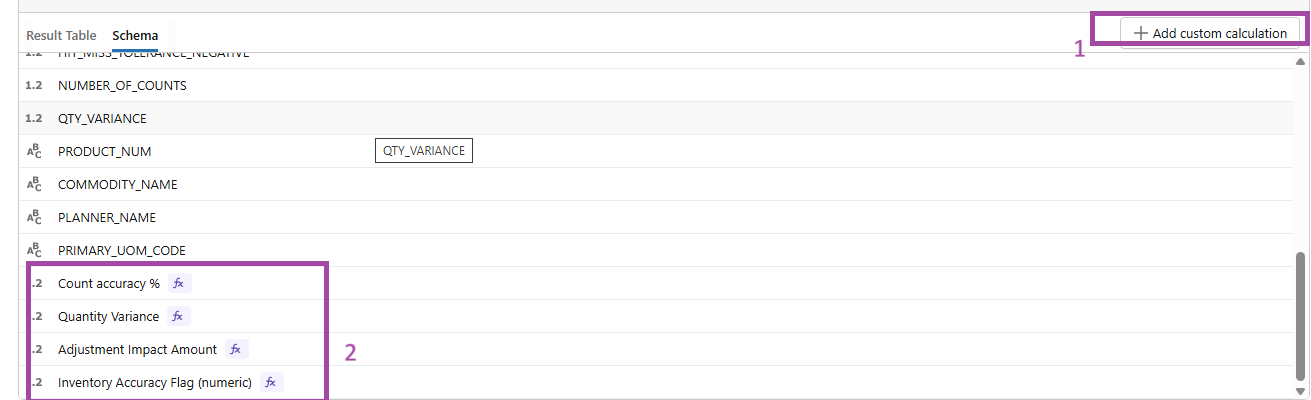
FIG (13)
Accurate SQL logic ensures reliable KPI calculations and results in a precise and meaningful dashboard presentation.
Datasets and custom calculations have been similarly created for ORDER MANAGEMENT and PURCHASING.
Sample Dashboards:
INVENTORY ANALYSIS
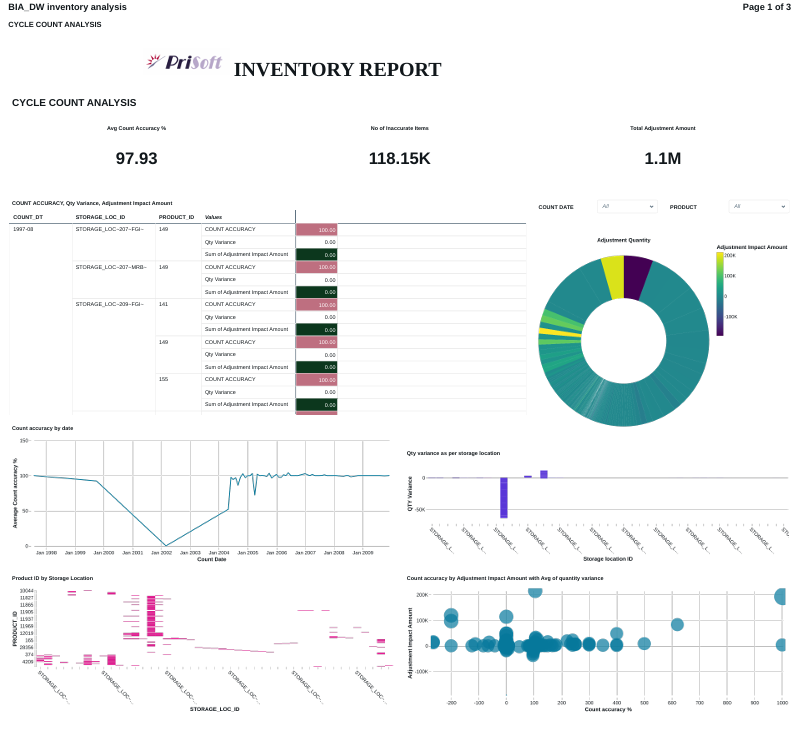
FIG (14)
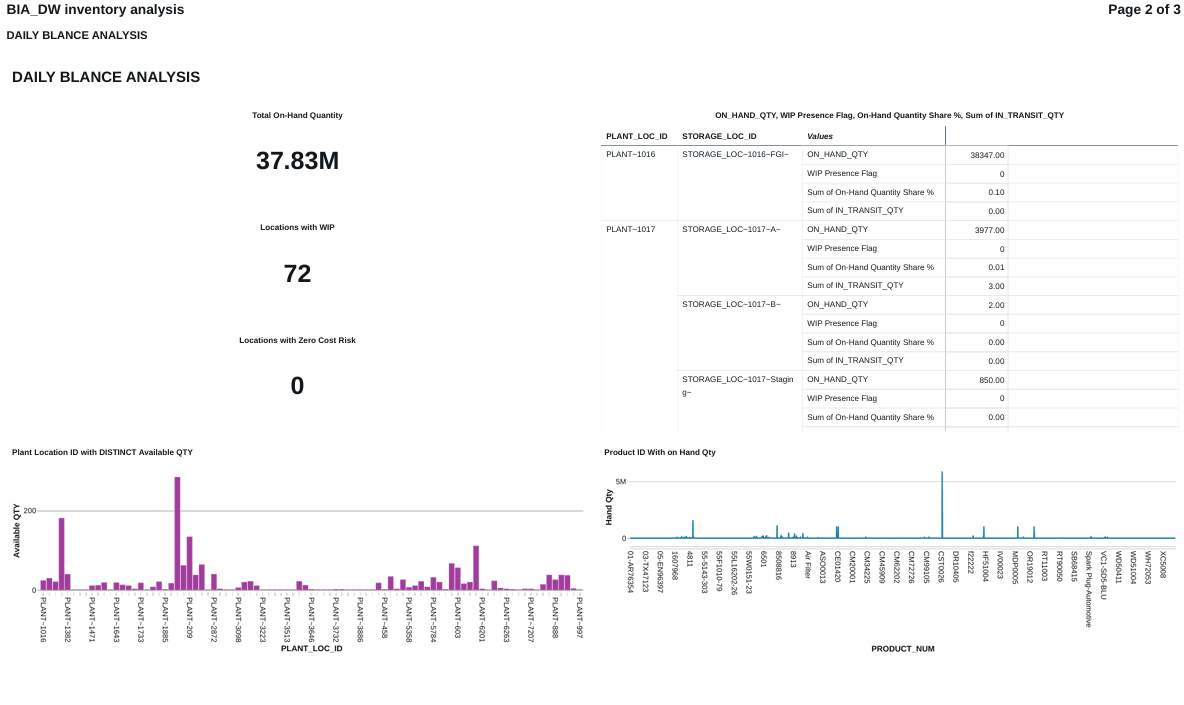
FIG (15)
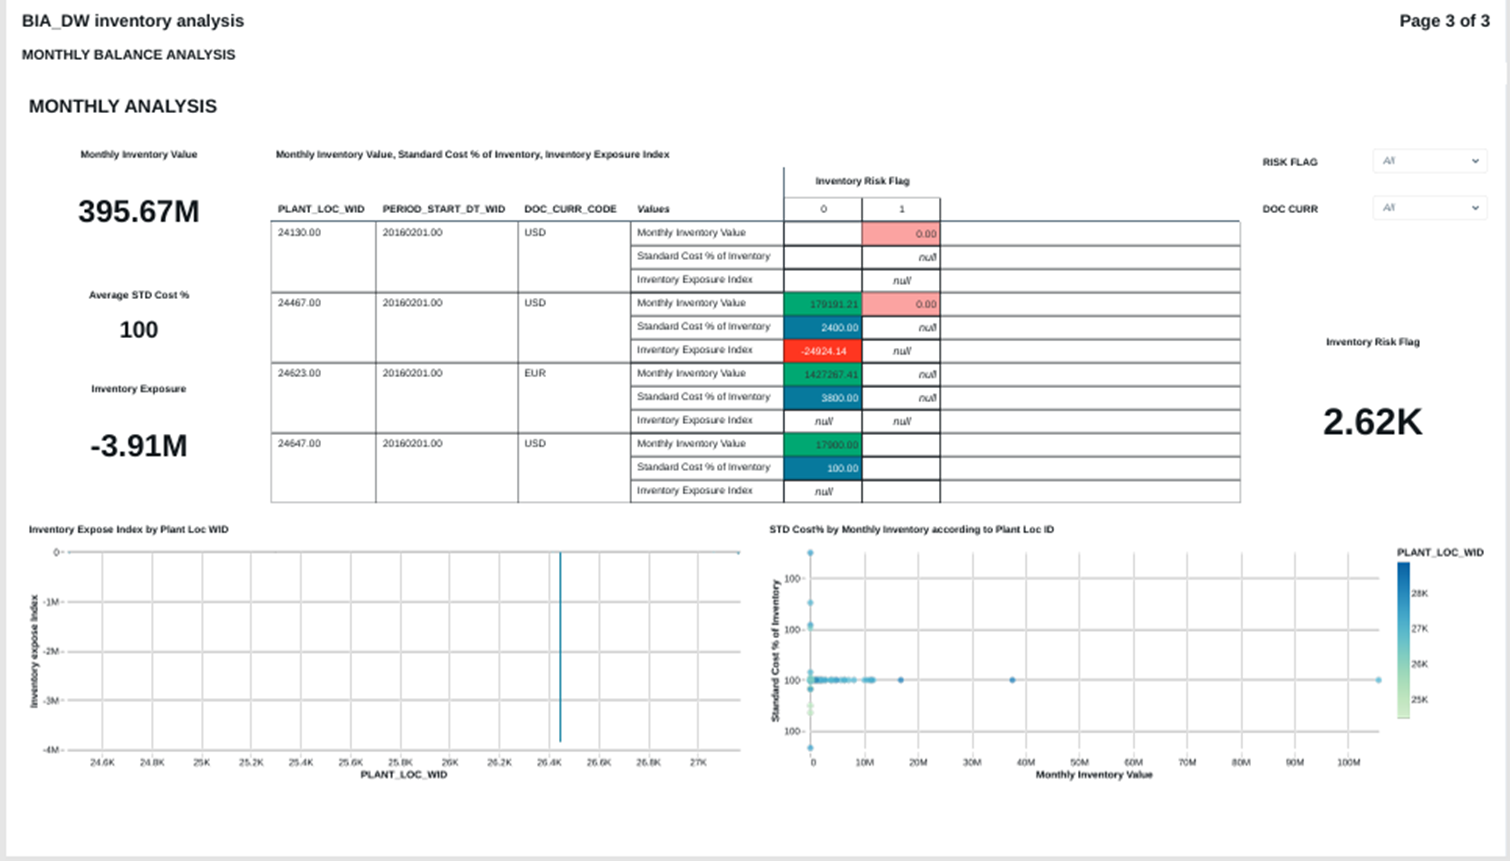
FIG (16)
ORDER MANAGEMENT ANALYSIS
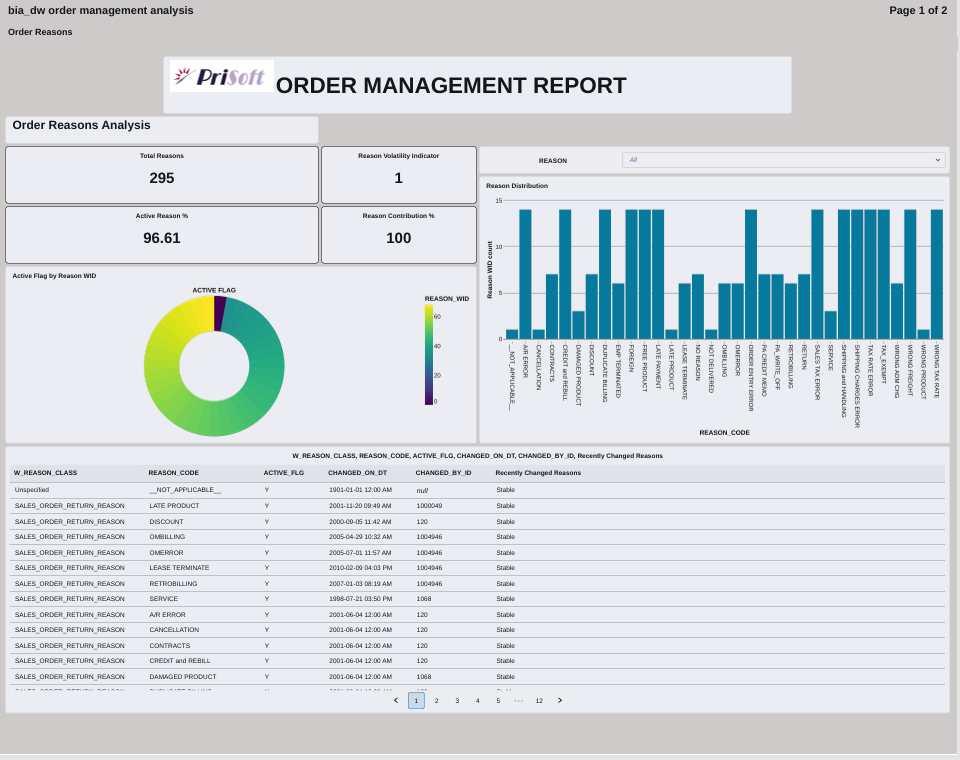
FIG (17)
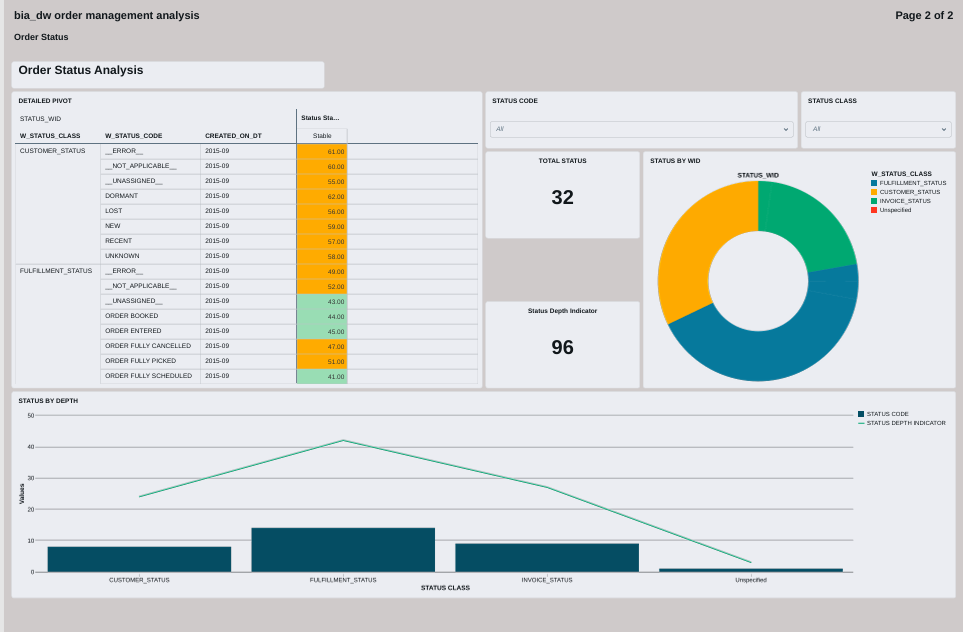
FIG (18)
PURCHASE ANALYSIS
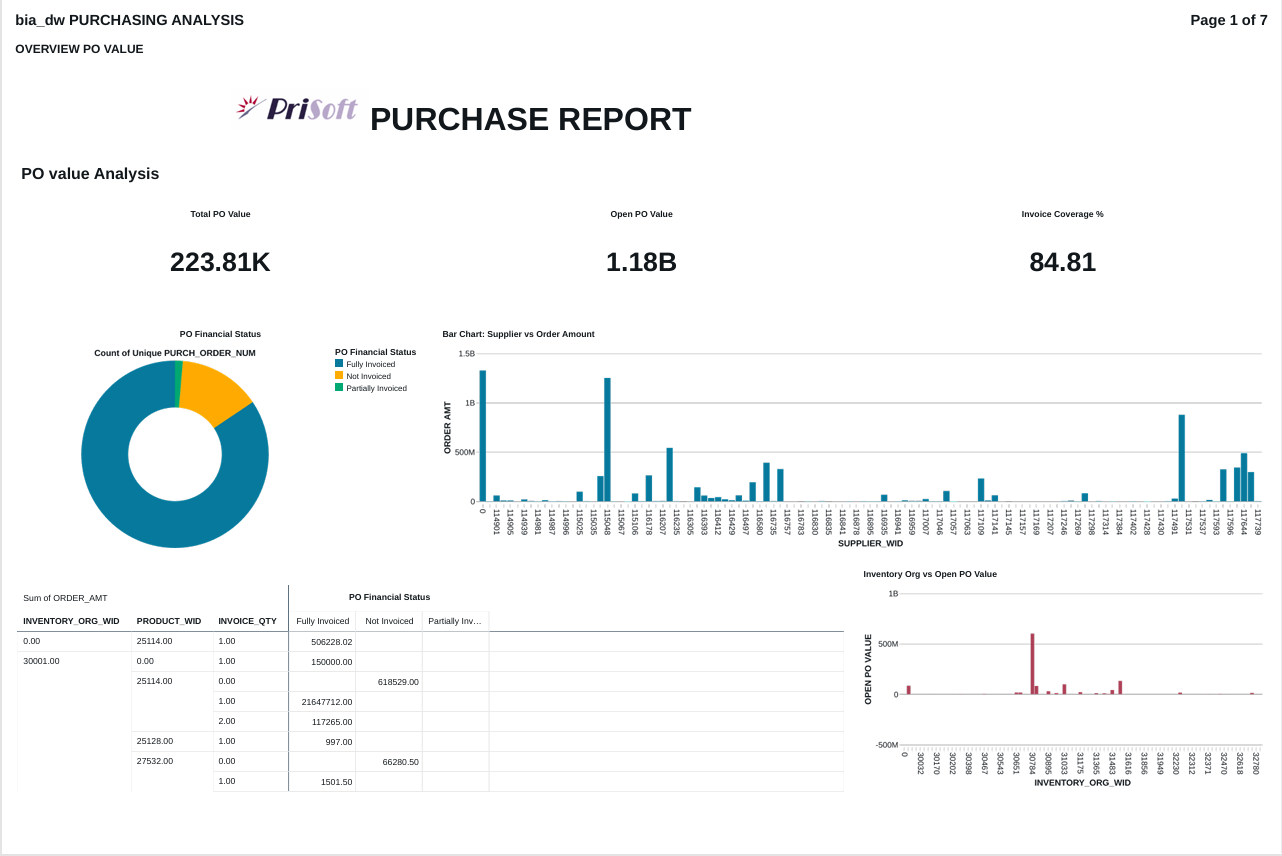
FIG (19)
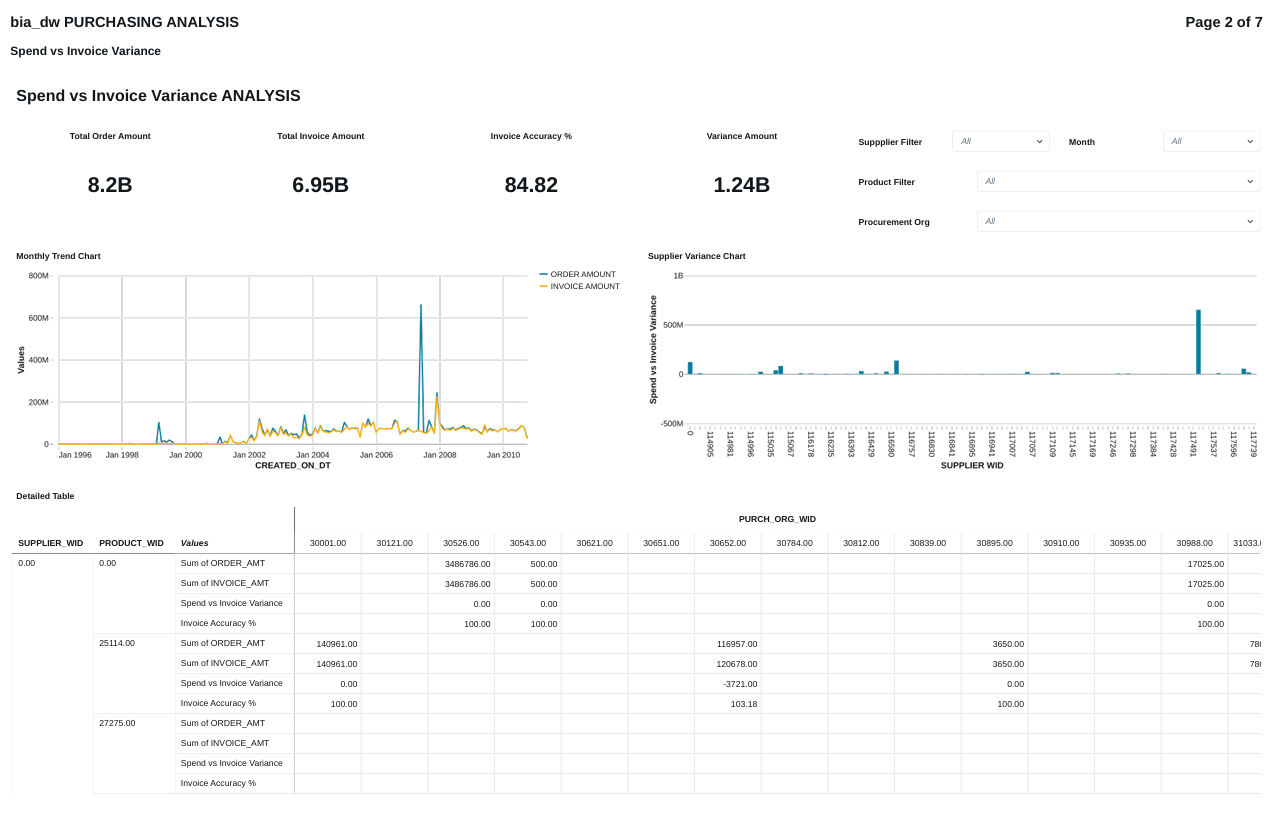
FIG (20)
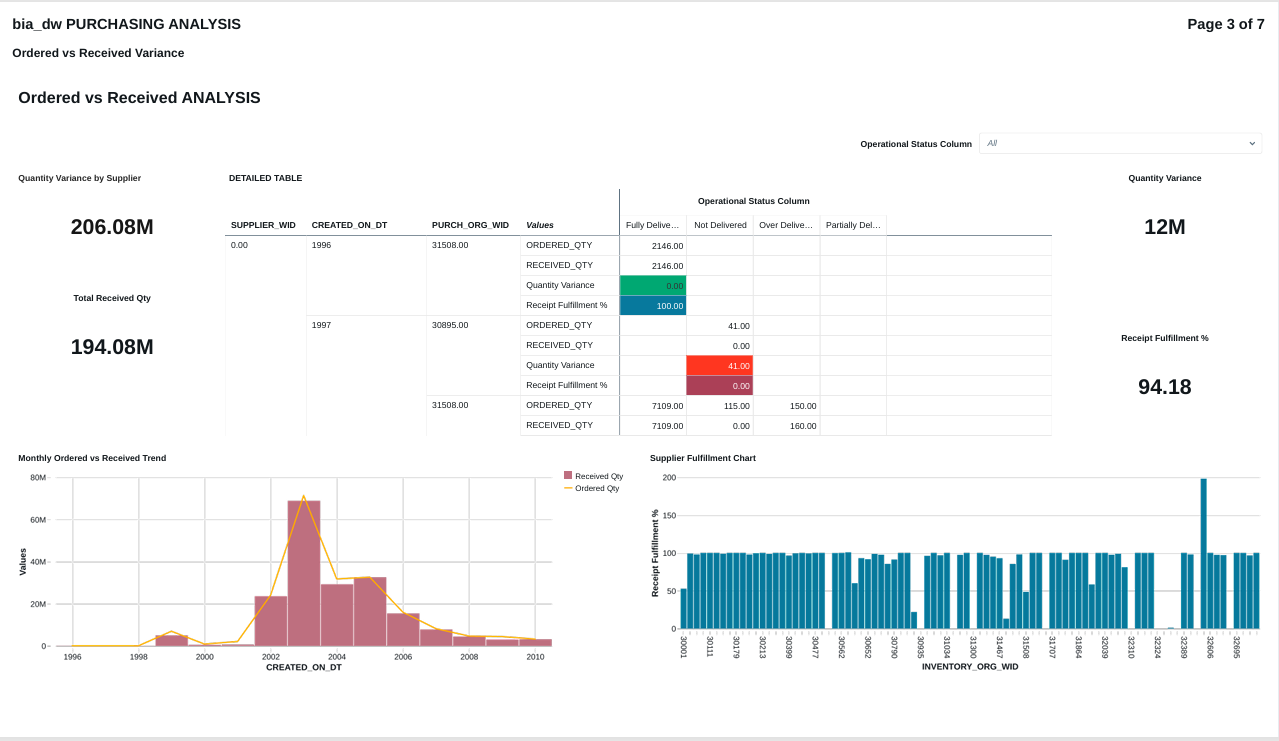
FIG (21)
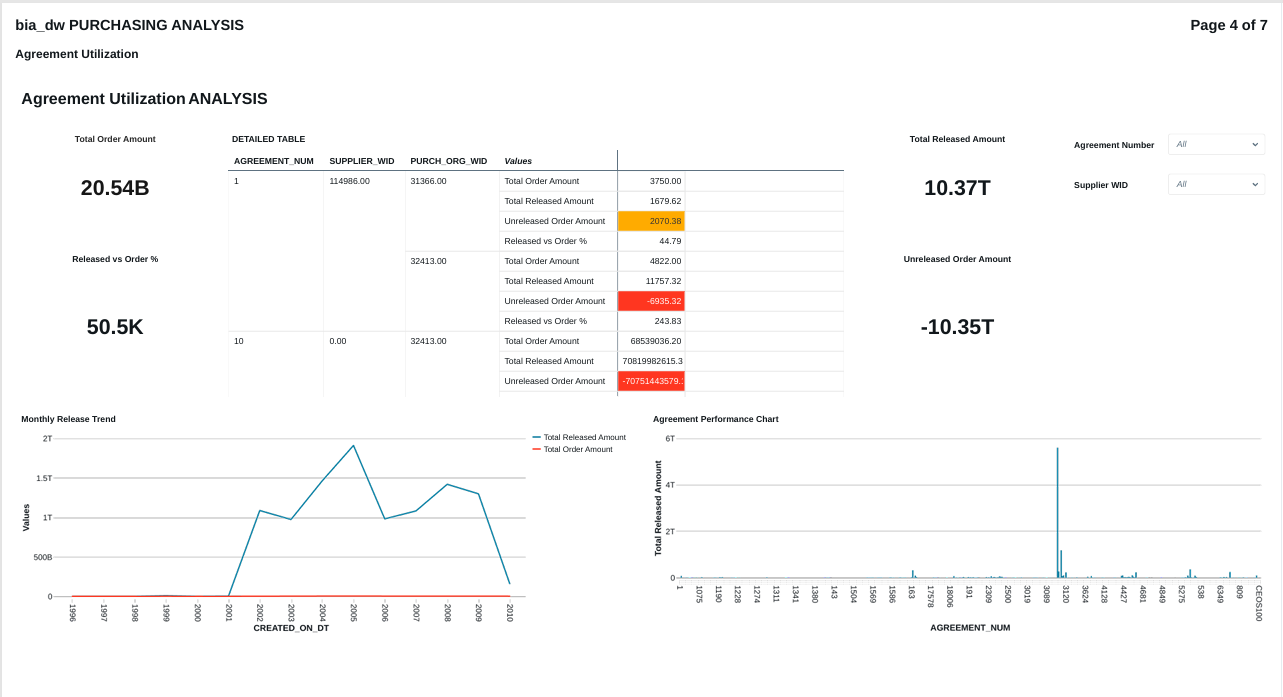
FIG (22)
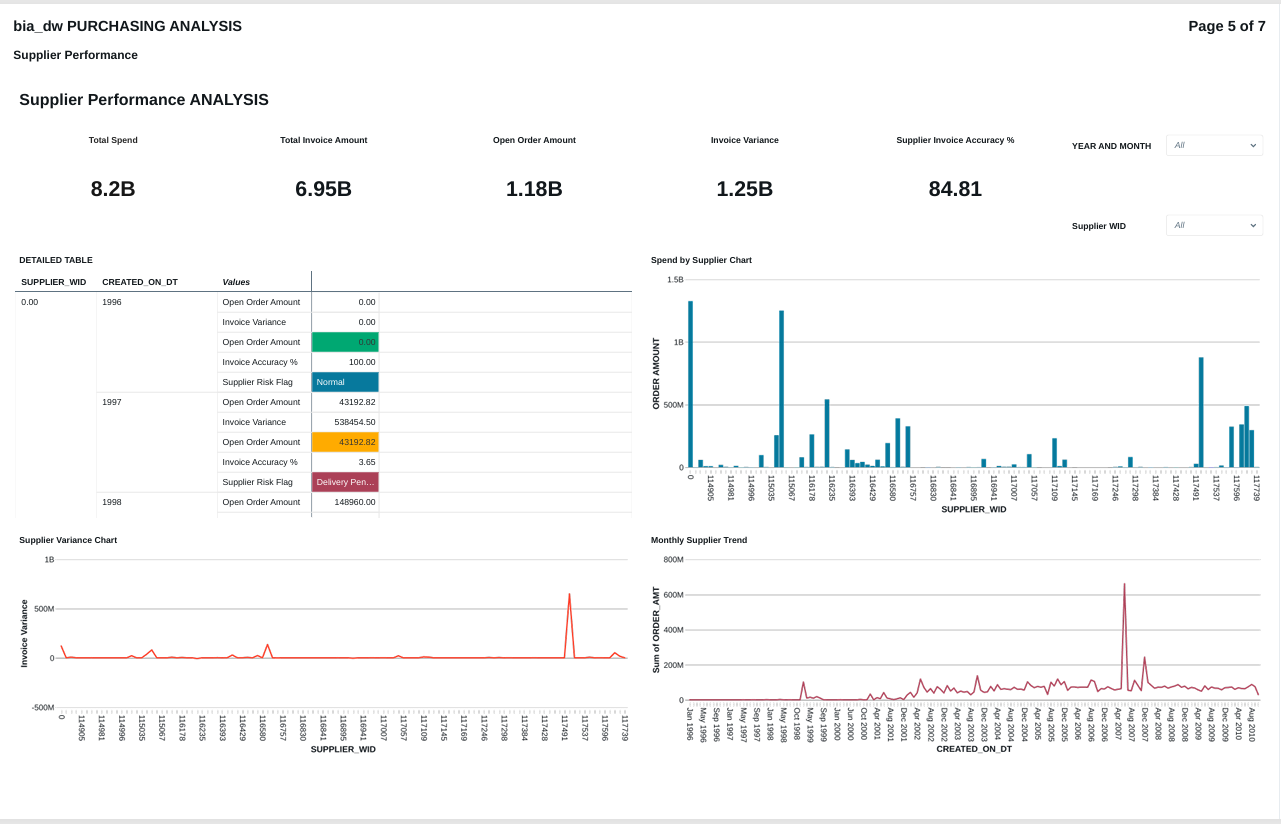
FIG (23)
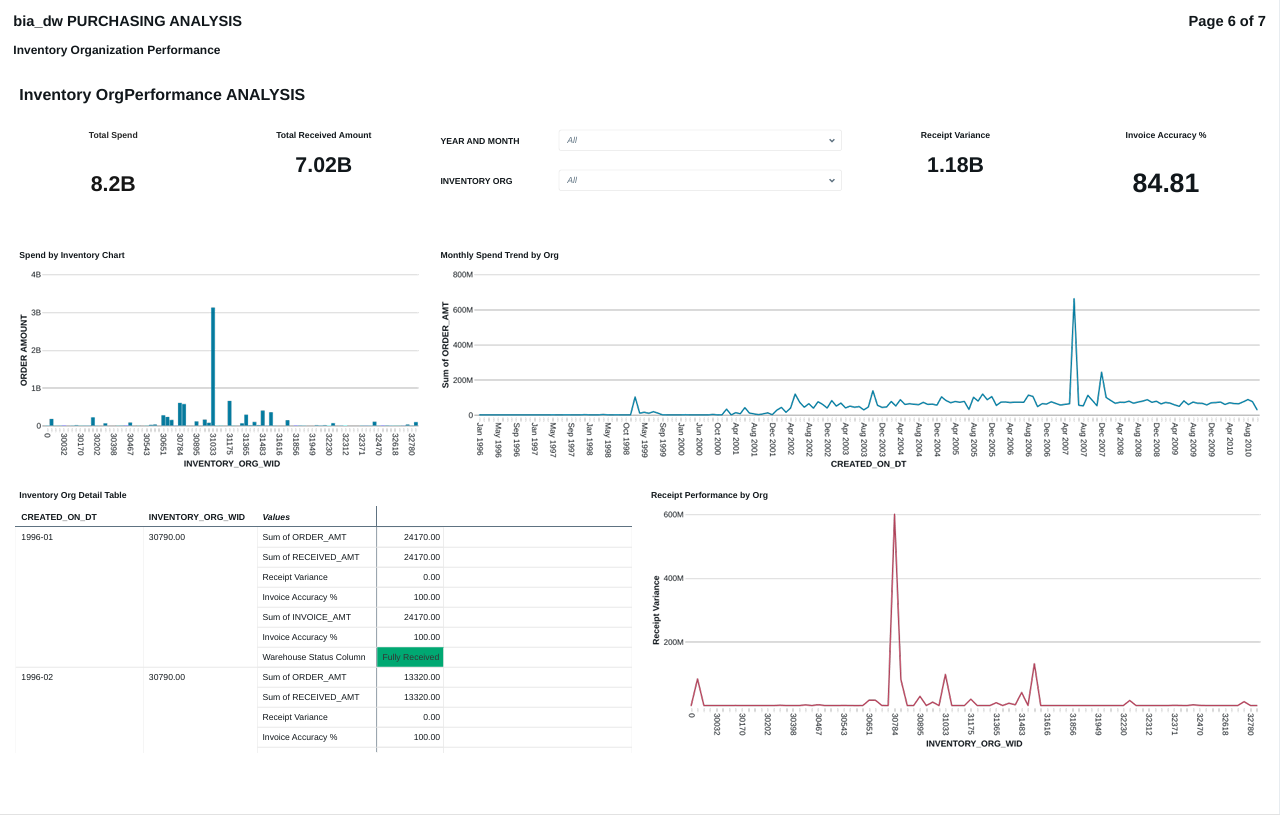
FIG (24)
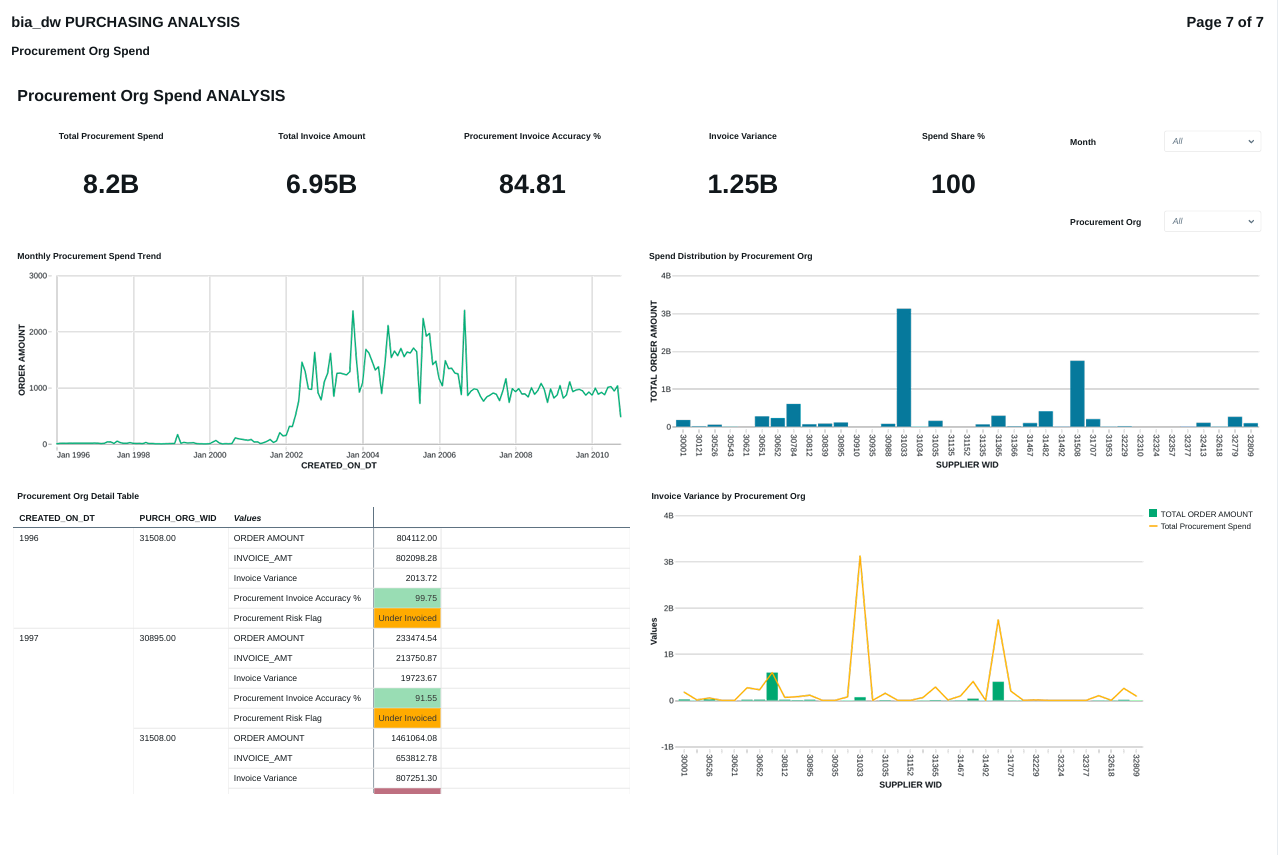
FIG (25)
Conclusion:
The OAS to Databricks migration demonstrates a structured lakehouse implementation strategy. A secure Oracle connection was established through the Databricks catalog, exposing the bia_dw schema and enabling controlled data access. Instead of directly querying source objects, tables were migrated into a dedicated operational schema (ebs_Databricks_catalog.ebs_base) to ensure isolation, governance, and transformation flexibility.
By leveraging structured catalog and schema separation, the solution follows best practices for enterprise data architecture. SQL-based datasets and custom calculations were used to modularize business logic for dashboard creation, ensuring reusability and KPI accuracy across Inventory, Order Management, and Purchasing analytics.
This architecture reduces dependency on legacy OAS reporting, improves performance through optimized storage and compute management, and provides a scalable foundation for advanced analytics within the Databricks lakehouse environment.