Introduction
Every customer management depends upon your capabilities to discover, store and manipulate the data. The Tableau CRM can help you a long way in achieving this. It’s a very powerful tool with dynamic mobile friendly analytical capabilities.
What is Tableau CRM?
Tableau CRM is a self-service data visualization and business intelligence (BI) platform that integrates salesforce data with external data. Formerly known as Einstein Analytics, this tool acquires some of the most powerful data analysis capabilities in the market.
Recipes in TCRM
A recipe is a sequence of transformations that Tableau CRM performs on source data before loading it into a dataset. You can then output the resulting data to a new target dataset.
How to create recipes
Before creating the recipes, first you need to navigate to the recipes page. For that follow the below steps to navigate to the recipes page…
- First, login into your salesforce account and in the homepage click the app launcher and select analytics studio.
- Then look for the setup option which is on the right top corner ad left of the notification option.
- Click the setup option and select Data Manager.
- Then go to the Dataflows and Recipes which is on the left top of the screen then click recipes and then create recipes.
After clicking the create recipes button below screen will appear
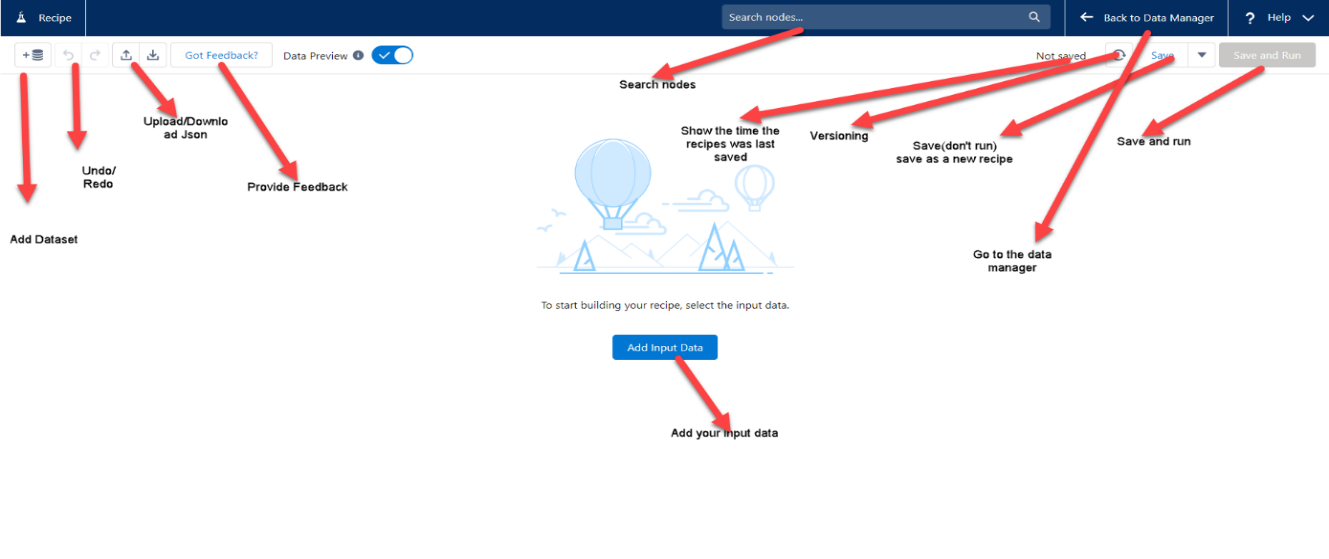
Describing the above screenshot from left
- Add Dataset-This tab is used for adding datasets that exist in the tableau CRM. It can come from salesforce synced objects, other datasets that exist in tableau CRM either from csv or from other dataflows or from other databases.
- Undo/Redo- This feature is available in most of the tools. It is used to move backward and forward for your steps respectively.
- Upload/Download JSON- We can download an existing recipes and upload here. In this we can edit our JSON also.
- Provide Feedback- You can provide the feedback for the salesforce data recipes.
- Search Nodes- If you want to find any node in the dataflow, you can search that here.
- Not saved- This shows when the recipes were last saved.
- Versioning-This shows the version of the data prep and what is new in the current version.
- Save-It provides 2 options
- Save but don’t run
- Save as a new recipe
- Save and run-This is used to save the recipe and run it instead of waiting for a scheduled job to run.
- ? Help-It helps to solve your queries about this feature.
- Back to the Data Manager-Take us to the Data Manager but on the Recipe Page.
- ADD INPUT DATA-This is the first step you have to do for creating a recipe. This is used to add the source data for the source node.
Let’s get started with creating recipe

The above screenshot shows the button add input data by which you will add the source data.
Now, we start by clicking Add Input in the above page. Let’s select Opportunities_SP dataset from Local connection and select the fields. The dataset will be added to the recipe. Click on the icon and we will an input window open up.
After clicking the add input data the following screenshot will open which will be containing your datasets, recipes, data flows and salesforce sync objects.

First choose a dataset for the initial node the click the next button which is on the right bottom then following screen will appear. In this I will be selecting the Opportunities_SP dataset.

Now, we have successfully added a dataset. we will join another dataset. In this case, click on the plus sign next to the Opportunities_SP dataset. Select Account_Owner_PP dataset. By clicking the join node to configure it that will be like below screenshot.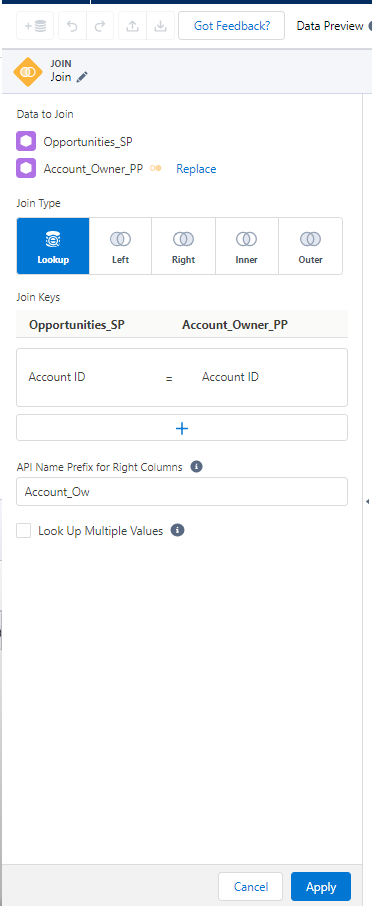
- This shows that Opportunities_SP is Joining to Account_Owner_PP using a lookup.
- We will use Account Id both from Opportunities_SP and Account_Owner_PP dataset as the join keys. After that, click Apply, now we have successfully joined two datasets.

- Click on the plus sign next to the Join and choose the transform node because this node allows us to add a new formula column to the dataset.
- Transform node allows to do multiple relative row calculations and can also rename an API, bucket, flatten, clustering, sentimental analysis, pivot and more.
- By clicking Transform, windows open up and we see the following:

- On the top of the screen there is a transform menu bar by which you can transform the data in your datasets as per your requirement. See the below screenshot.

- Next, we add a filter to the dataflow. Filter is used for selecting a particular item in a column.

- Next, we can add a final touch with the output transformation and we are done. Now let’s save it and run the dataflow. Now we can see the output columns as shown below. You can see the output columns and the data.

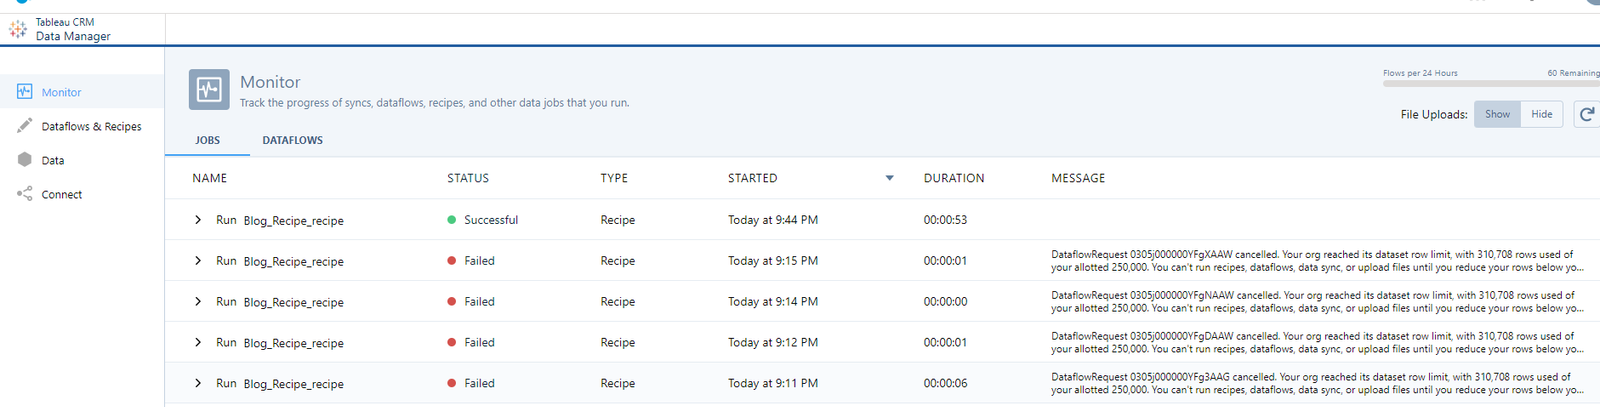
- Then we need to go back to the data monitor tab and there we can see our recipe being run. Here’s our final result that the dataflow has run successfully. We can also see that initially it didn’t run and failed and that was because of the data limits exceeding. While troubleshooting we have to make some space by deleting datasets. This is required only when the data exceeds the limit.
Dashboard Creation
Now we can create a dashboard based on the recipe. The dataset we used to create the following dashboard is “DTC_Opportunity”. Now let’s dive in to create the dashboard.
Here we are taking the fields and creating dashboards based on different filters and toggles. The filters are based on Stage, Industry and Billing Country. The toggle is based on Opportunity Type which shows data accordingly. Next, we have the card view of Total Amount, Total Opportunities. Next, we have the line chart showing the expenditure based on every month of a particular year. This can help in knowing the growth/drop in business over a particular period of time.
Next, we have the Stacked Column Bar Chart which shows the number of Opportunities based on the stages in different months. This shows the growth/drop in Opportunities month-wise.
The next one is the table format where users can see the values in a tabular manner.
Finally, we have a donut chart which explains the maximum amount spent per Opportunity Type.
Here’s the dashboard visualization at an overall view.

Now let’s change the filters and check the values. Let’s select Billing Country filter as ‘USA’ and toggle as ‘New Business/Add-On’. Now here’s how it looks.

So, this is how the dashboard looks as per business requirements. The user can select according to their choice and filter out results as per requirement.
Conclusion
Tableau CRM have one of the best features in it. Before creating a dataset, we can extract and transform all the data as per our requirement. We don’t need any other individual tool for data transformation. In recipe we can make all type of transformations and can keep the data ready for dataset.