Abstract
Modern ETL tools should be capable of extracting data from different sources like RDBMS, Flat files, Cloud Data-Stores, Data Lakes, Warehouses etc. and should smoothly build integration between them. Data transformations or pre-processing tasks have become complex because of variety of data often in semi-structured or un-structured form. Data pre-processing tasks are now preparing data to be fed into Machine Learning Models. Afterwards these data-extracts are to be loaded into desired location with prescribed format.
Alteryx is providing one stop solution for data access, preparation and management with a zero to no-code development environment. It can Prep, blend and analyze data easily. The Graphical User Interface (GUI) and the drag and drop feature makes it very intuitive in using for day-to-day data related tasks. Alteryx comes with 30-day trial, through which anyone can learn about its Designer platform (Alteryx.com).

Alteryx Designer Interface
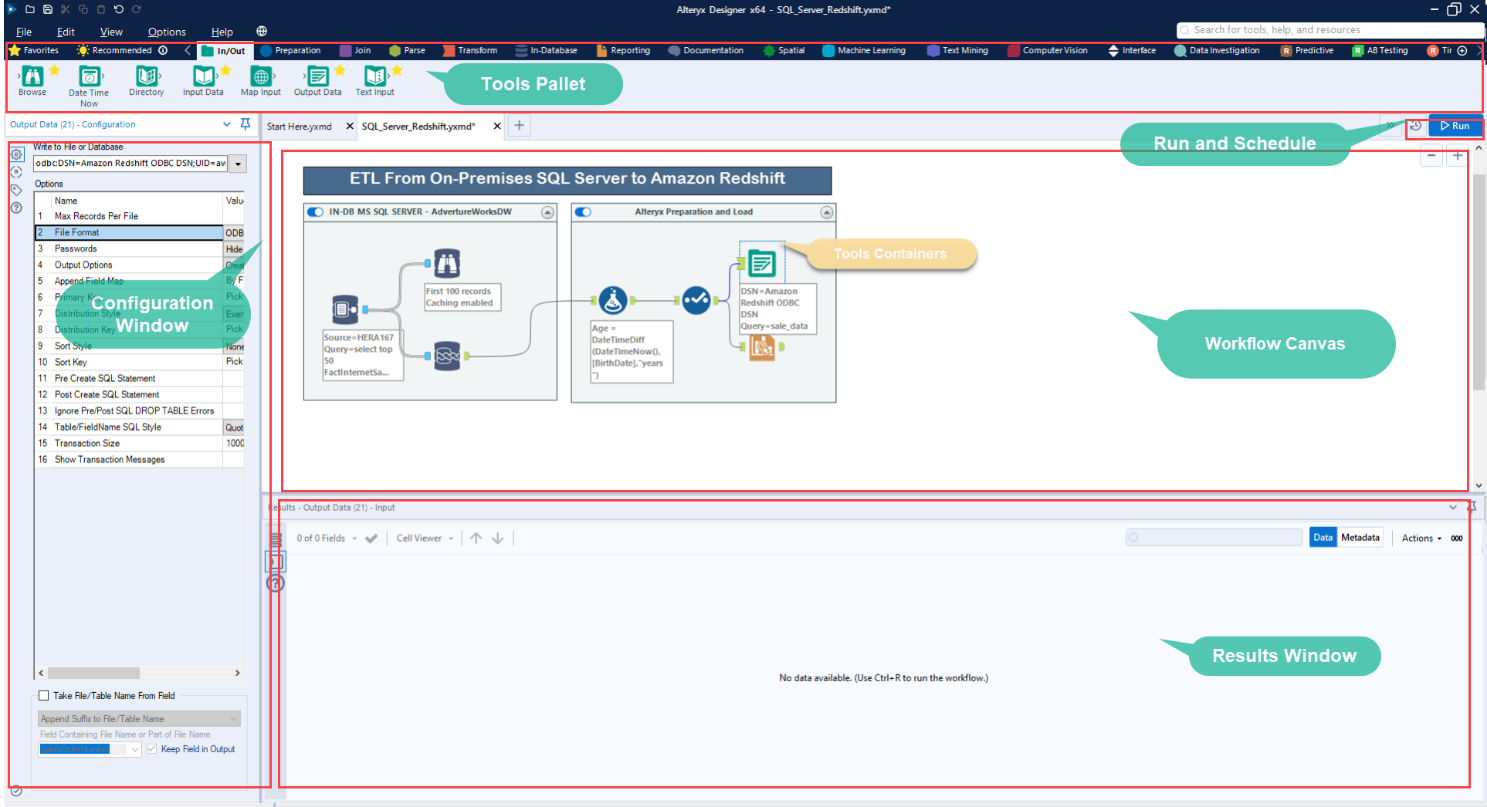
Alteryx has a simple yet intuitive user interface. Some of them are discussed below.
- Tools Pallet: Below the menu bar there is tool pallet that consists of all the tools categorized by different needs of the users. Tools can be marked favourite to quick access or can be directly searched in the search box.
- Workflow Canvas: The white space at center is meant for workflow designs. The tools are aligned in grid structure inside it. Workflow canvas can be further organized by ‘tool container’ which can be found in Documentation Tool.
- Configuration window: Left to the workflow canvas, the window shows configurations options for selected tools, workflows etc. This window varies upon selecting different items or tools.
- Results window: It shows the workflow state, results, errors, warnings, messages, data output, metadata etc.
- Run and schedule Buttons: User click on Run button to start the workflow execution. Schedules can be set using this schedule button.
Hands on:
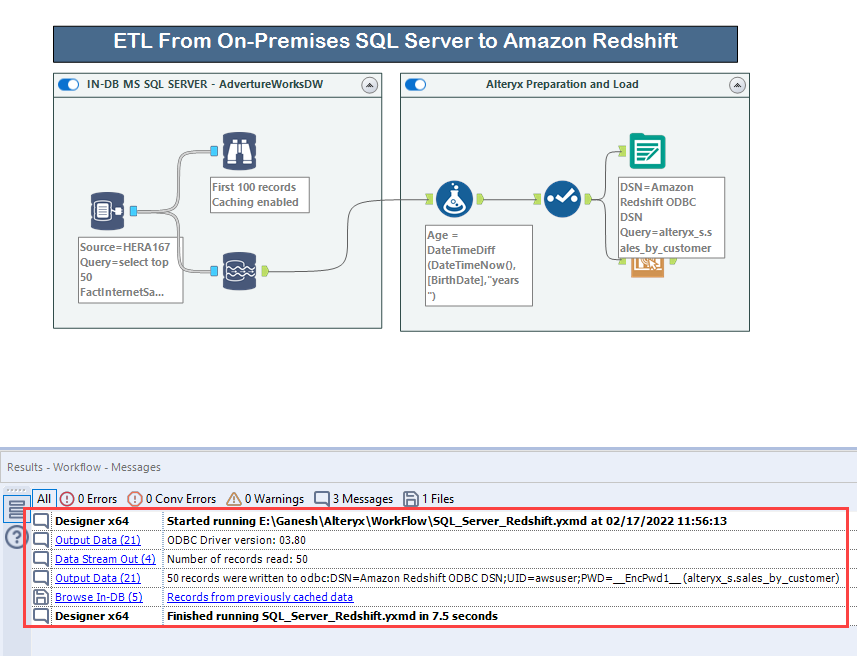
In this blog we will fetch data from on-premise SQL Server database and sent it to Redshift. In the mid-way minor transformations will be applied to the data. The overall process is categorised into 2 tool containers such as:
- In-Database SQL Server
- Alteryx Preparation and Load

1. In-Database SQL Server
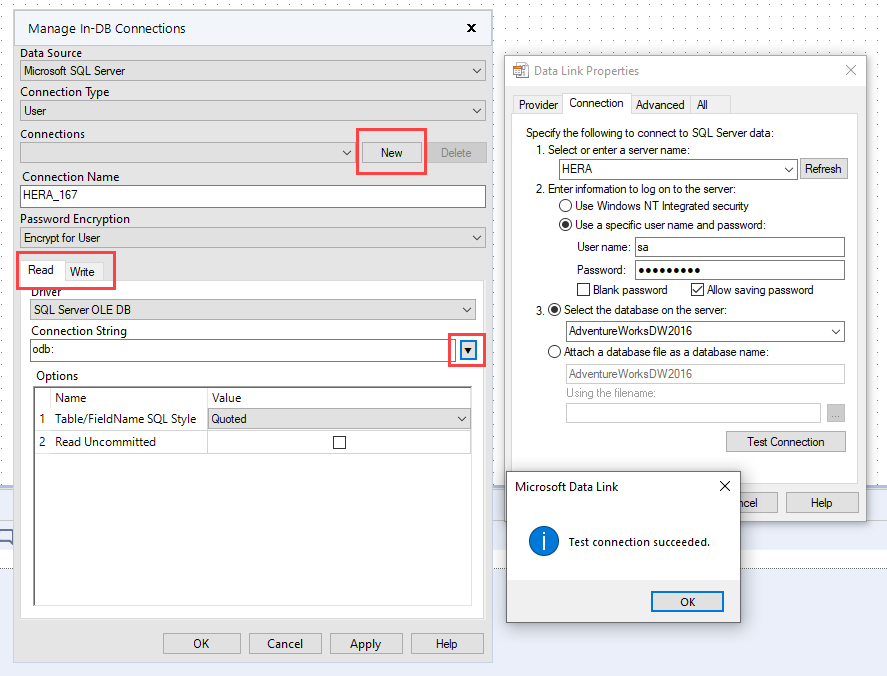
- Get Connect In-DB tool from In-Database tools category. In the configuration panel drop down Connection Name > Manage Connections.
- Choose Data Source as Microsoft SQL Server. In the Connections click on New Button. Give Connection Name.
- In Read tab, drop down near Connection String and choose correct provider (Microsoft OLE DB Provider for SQL Server).
- Add necessary details such as Server Name, User Credentials, Database name etc. Then Test Connection.
- Similarly set connection in Write Tab. Then apply.
- To extract data, one can use either the Visual Query Builder or SQL Editor. Visual Query Builder provides GUI to build star-schema like structure. On the other hand, SQL Editor provides the legacy text editor for SQL Queries.

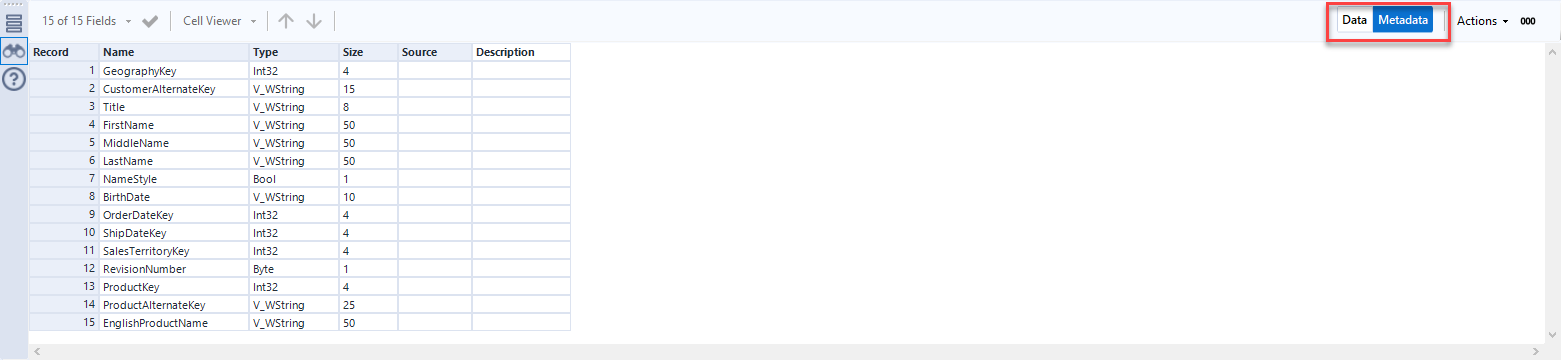
- Drag and Drop Browser In-DB. It helps in reviewing data in any stage of In-DB Streams. Click on Run button. In the results panel output data can be seen. Meta data can also be seen clicking Metadata Button.
- In-DB data can not be directly used in standard workflow. Another element called Data Stream Out is used to stream data to standard workflow, so that data can be processed in Alteryx Designer Tools.
- Go to documentation in Tools Pallet and drag & drop Tool Container. Select all the tools and drop them into the container and rename the container.
- These containers can be activated or deactivated using the toggle button.
2. Alteryx Preparation and Load
Alteryx has different tools under different categories that are useful in Data Preparations and Analysis. In this section the streamed-out data from the previous stage will undergo minor transformations.
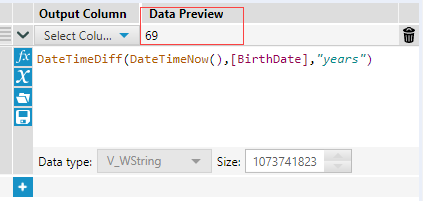
- Task: Find age of customer and add to a new column.
- From Preparation tab drag & drop Formula tool. Drop down select column and click on +add column and assign it a new name.
- Write the formula in blank space. Result can be seen in Data Preview.
- Drag & Drop Select tool from tools pallet. Using this we can select, deselect, reorder, rename, change data type, size etc of a field.

- Output data can be saved to a file or database as per requirement. Here we will load the data to Amazon Redshift. Drag & drop Output Data tool.
- If you haven’t configured ODBC for Amazon Redshift, download Amazon Redshift ODBC driver from here and install it on your device. Open ODBC Data Source Administrator (64 bit) and select System DSN. Add necessary connection and test it.

- In the config-panel, Data Connection > Data Sources, Select Amazon Redshift (ODBC). Enter DSN and User Credentials then proceed.
- Then Enter <SchemaName>.<TableName>. The schema should be created beforehand. Not specifying schema will create the table in public schema in Redshift. Additional configurations can be done in config-panel.

- Click on Run Button to start the workflow. Process logs can be seen in the results window. Data load can be verified using Redshift Query editor. Select all the tools and drag them into a new container.
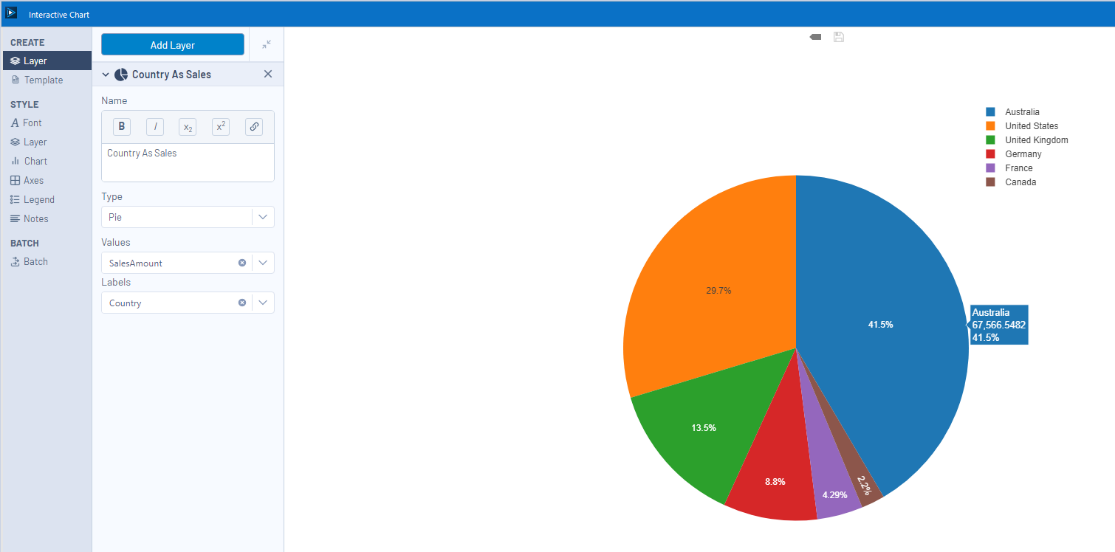
- Alteryx provides simple yet intuitive visualizations (Reporting 🡪 Interactive Chart) that can be easily applied to output of a tool. This tool is used to interactively create bar-charts, scatter plots, line graphs, pie charts etc. to visualize and understand the data.
- Alteryx workflows are saved in (.yxmd) format. Also, there is packaged extract (.yxzp) in Option > Export Workflow which includes assets to the workflow.
Conclusion
Alteryx is one of the market leaders in Data Preparation and Data Exploration category. it combines robust data cleaning and analytics capabilities with a no-code, low-code, drag-and-drop interface that anyone can learn. In effect, it makes data analytics more accessible to more people, no matter what field they’re in.
Though there is Trial Period for learners, Alteryx’s licensing cost is high for many small and medium scale organization. It consumes very high system resources. The visualizations provided are less advance compare to legacy BI-Tools.