Our data footprints increase constantly. Today, the world is filled with data but only less than 5% of it has been put to appropriate use. The need of the hour is not more data, but the capability to use it efficiently.
Overview
A data lake is a secured repository that can be used to store, discover and share structured and unstructured data at any scale. A data lake enables you to break down data silos and combine different types of analytics to gain insights and guide better business decisions.
In this post, we wish to explain how the data can be used efficiently using Amazon Web Service (AWS) lake formation. We will try to create a data lake by injecting data from AWS RDS for SQL Server. In the last part, we will see how to implement columnar security.
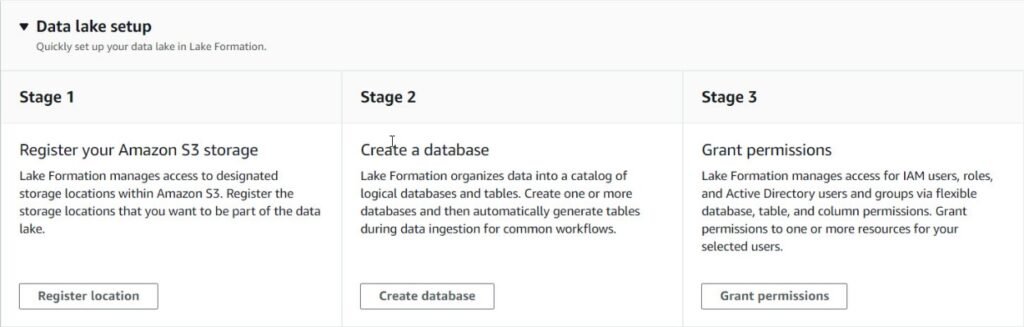
The walkthrough contains the following steps.
- Registering S3 location.
- Creating a logical database
- Loading data from Amazon RDS using pre-defined blueprints.
- Setting up security at column level.
Walkthrough
Registering S3 Location
- Login to AWS Console.
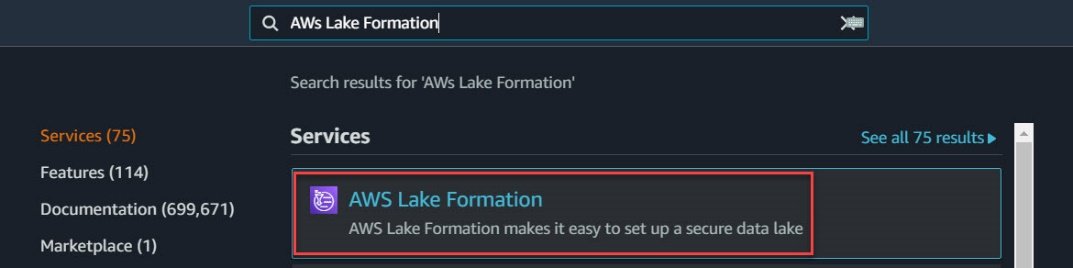
- In the Search tab, Search for “Lake Formation”.
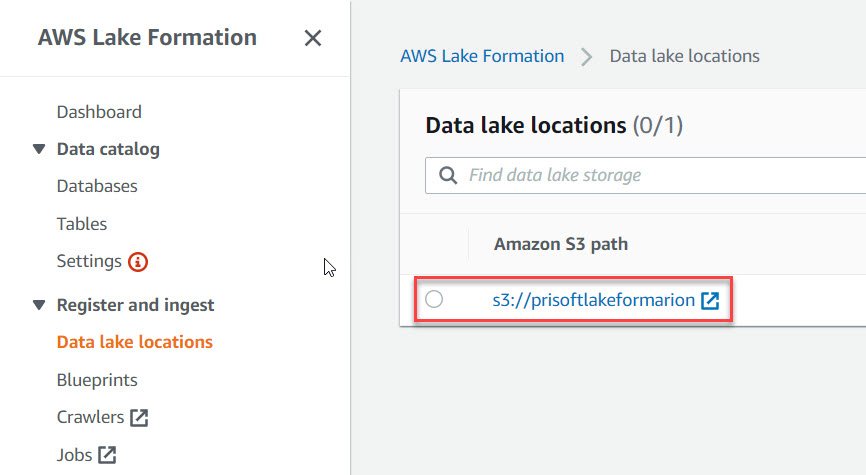
- In AWS Lake Formation Console, click on “Dashboard” option in the left pane and then “Register Location”.

- In the Register location page, Enter the S3 path for data lake and click on “Register Location”.

- Once done, you should be able to see your registered location in “Data Lake Location”.
Creating Database and Injecting Data
We will now create a database to hold our lake tables. These are logical databases.
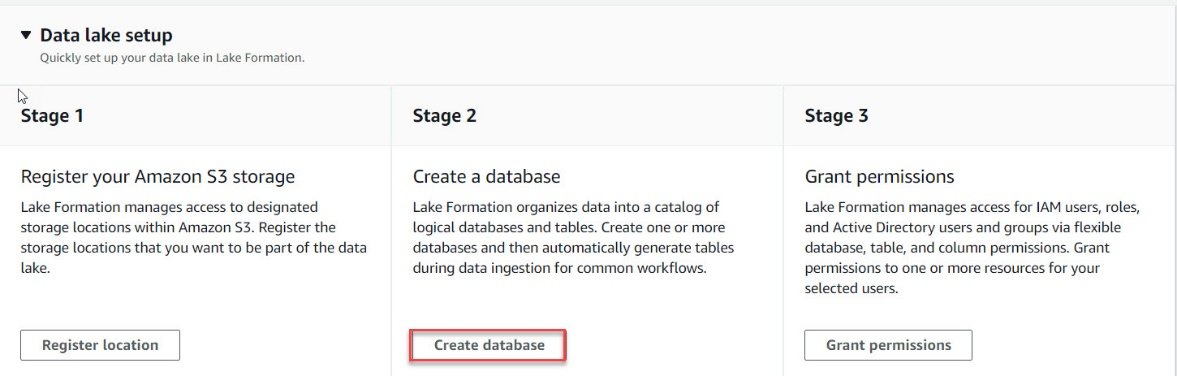
- Navigate to AWS lake formation Dashboard and click on “Create Database”.
- In the Database Details page, enter a name for the database to be created.
- Enter a S3 location where the datalake tables will be stored.
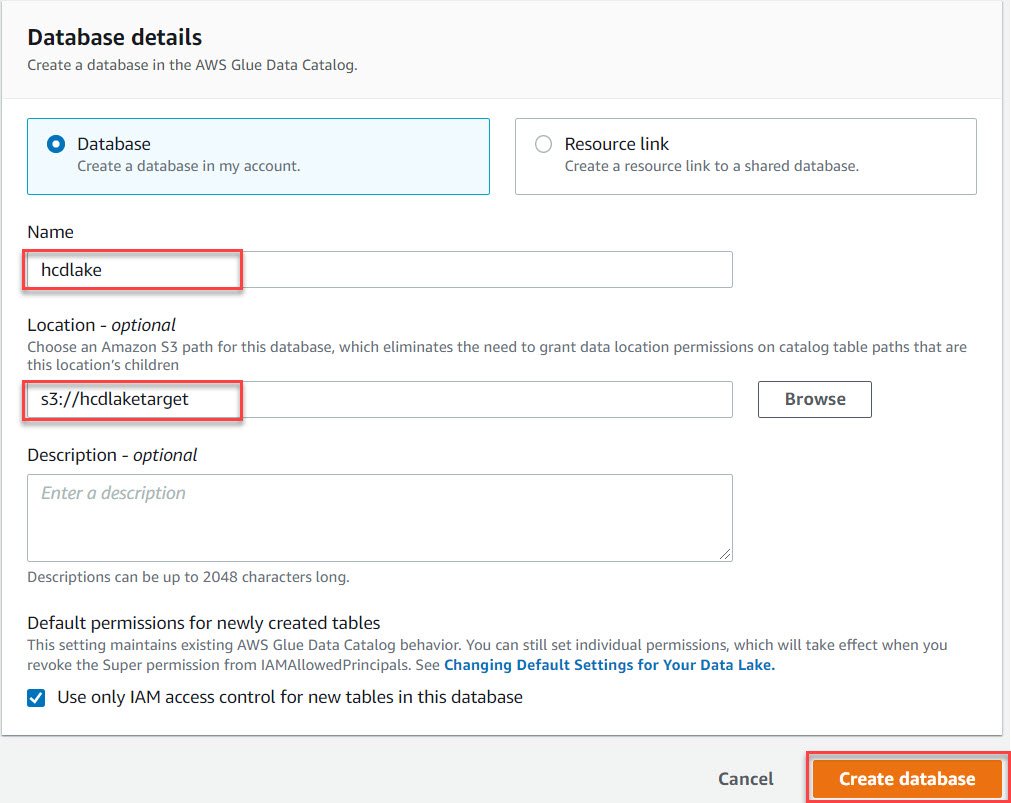
- Once all the details are entered, click on “Create database”.
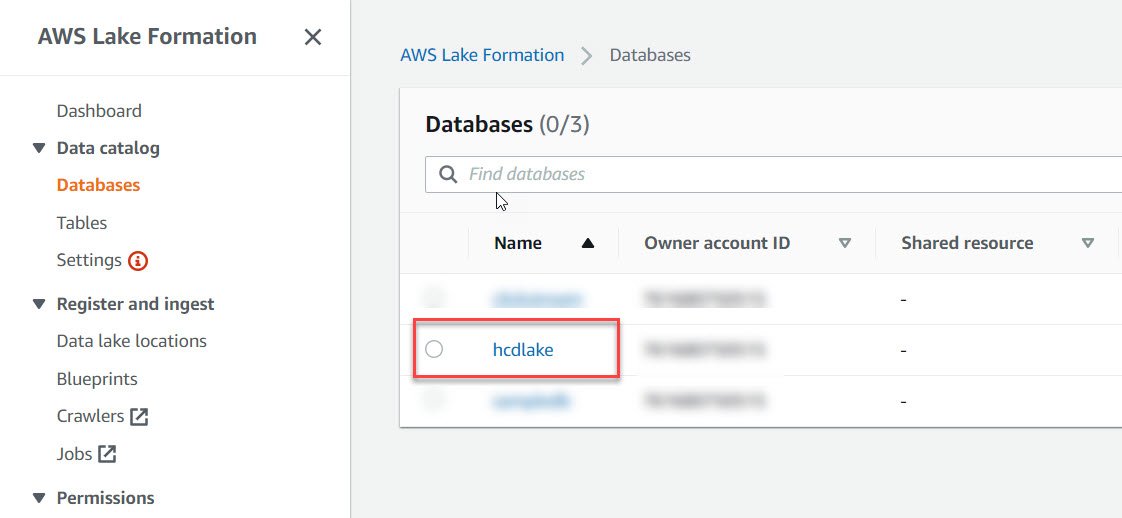
- We should now be able to see the database we just created in the database pane.
- Once the database is created, the next step is to ingest data. For this we will be using a feature called as “Blueprints” available in AWS lake formation.
Loading data from Amazon RDS using pre-defined blueprints
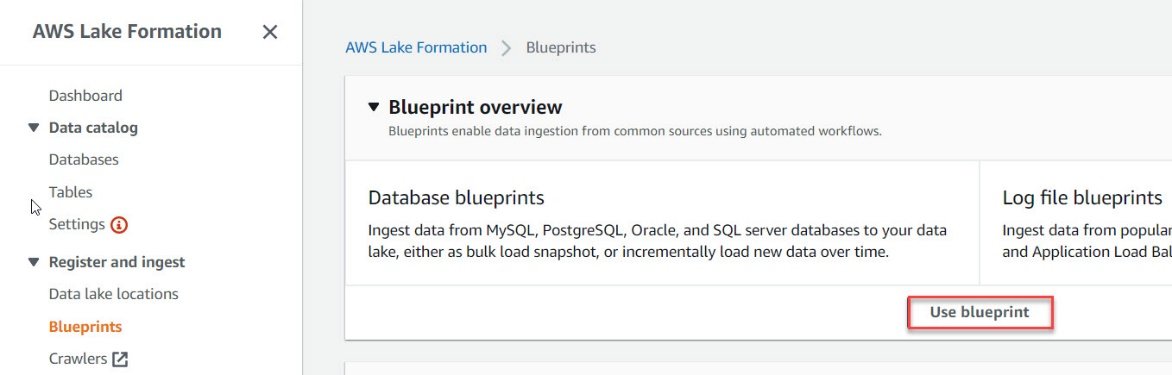
- Blueprints are predefined templates to ingest data from MySQL, PostgreSQL, Oracle, and SQL Server databases into your data lake.
- These can be used to load either incrementally or snapshots.
- Prior to loading data, we need to create a connection to Amazon RDS using Glue.
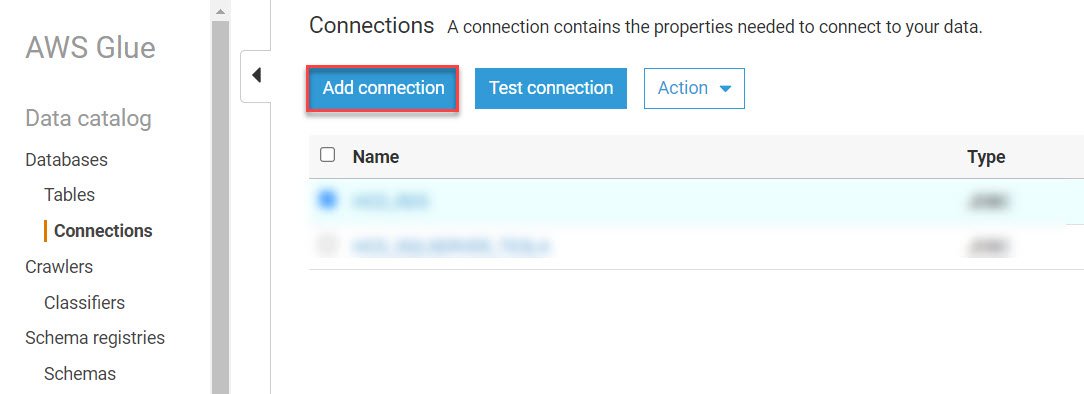
- In AWS Glue, On the connection pane click on “Add Connection”.
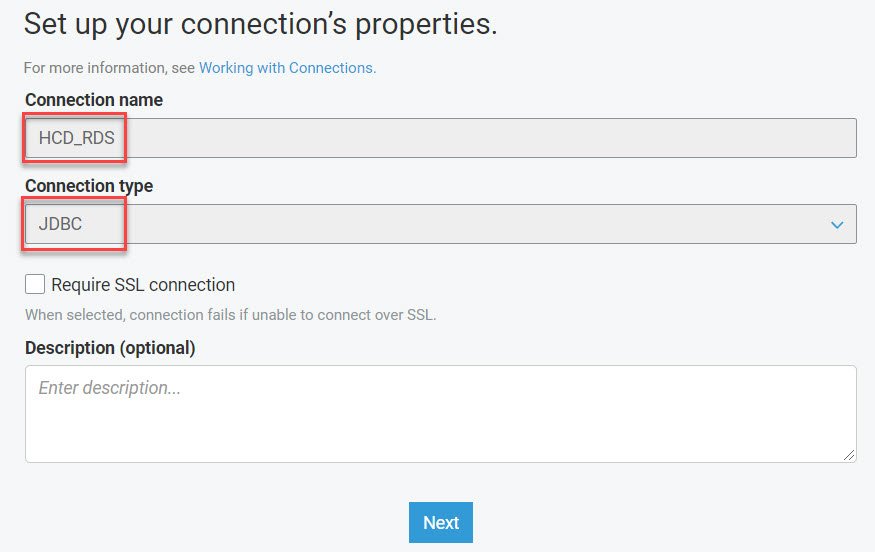
- Enter a name for the connection that you want to create. Also, Enter the connection type. In our case as we are loading from RDS we will use JDBC connection.
- In the connection details page, Enter the JDBC Url, Username, Password, VPC and the subnet of the RDS connection.

- Review the connection properties and click on “Finish”.
- Once the connection is setup, click on the check box next to the connection name and click on “Test Connection”.

- A successful connection message should appear.

- We will use this connection that we just created in Lake formation blueprint to ingest data. So, navigate back to lake formation.
- In the Lake formation console, click on “Use Blueprints”.
- In Blueprint Type Section, we will select “Database Snapshot” as we want to load all the tables at once. You can choose from the other options available depending on requirement.

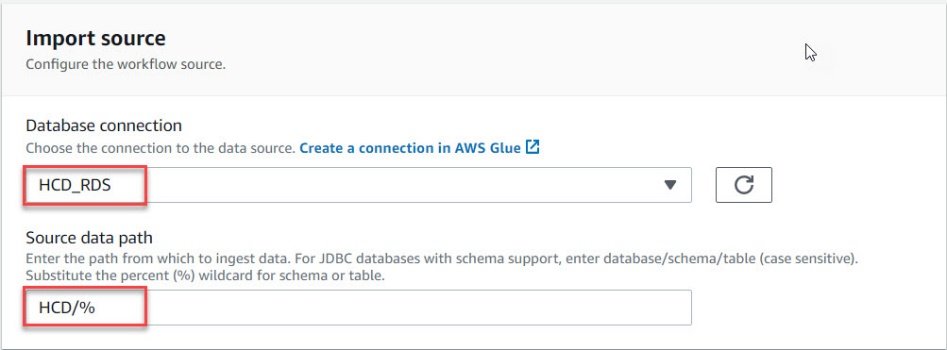
- In the Import source section, select the RDS connection that we created in Glue.
- Enter the source path, we will use % as wildcard to select all the tables in the schema.
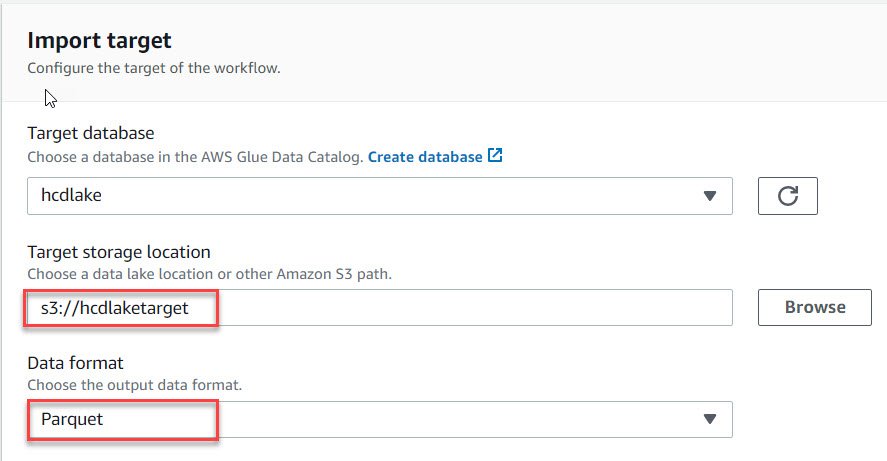
- In the import target section, Enter the data lake location details that you created previously.
- Select the format as Parquet for better performance.
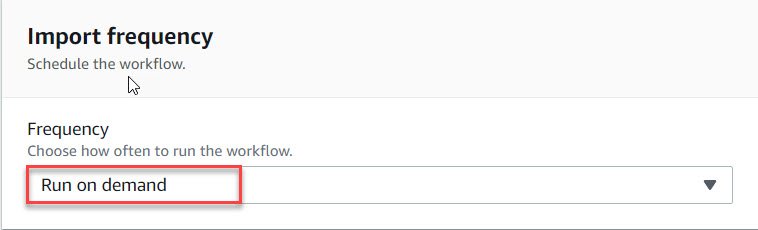
- Choose a Run frequency from the dropdown list. We will select “Run on Demand”.
- In the Import option section, Enter a name for the workflow.
- Enter a IAM user which has access to Glue.
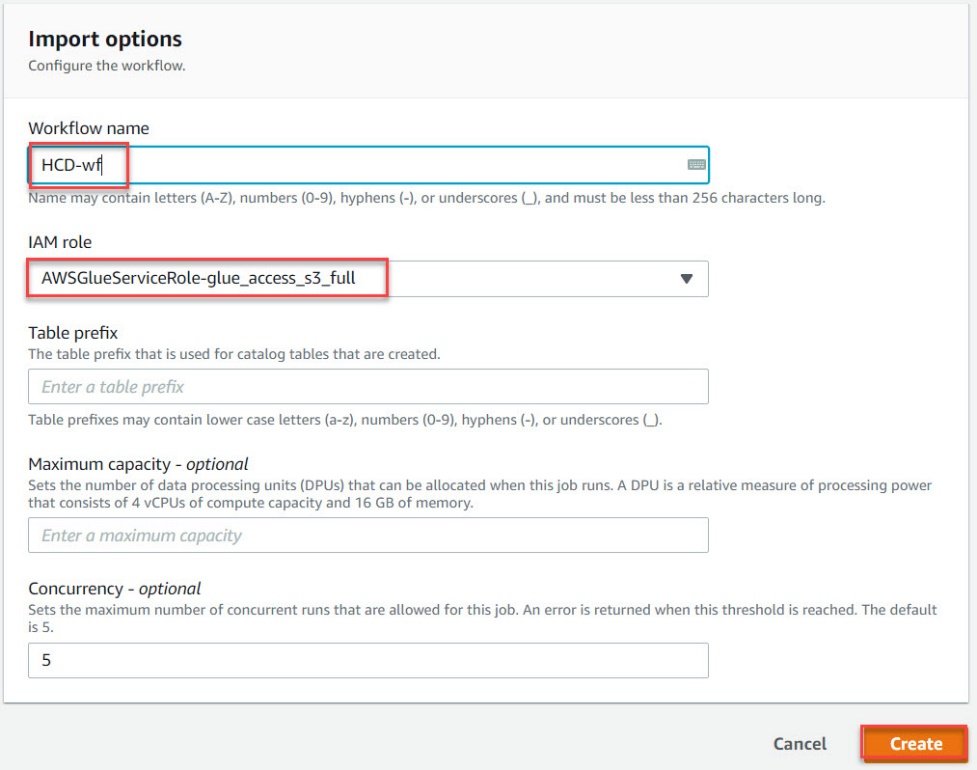
- Click on “Create”.
- This should take a couple of minutes to create the workflow.
- Once the workflow has been created, select the workflow and click on Action > Start to execute it.

- To monitor the execution, click on the name of workflow. This will take you to the “Workflow Details” page.
- Here we can check the “Run Status” and “Run ID”.
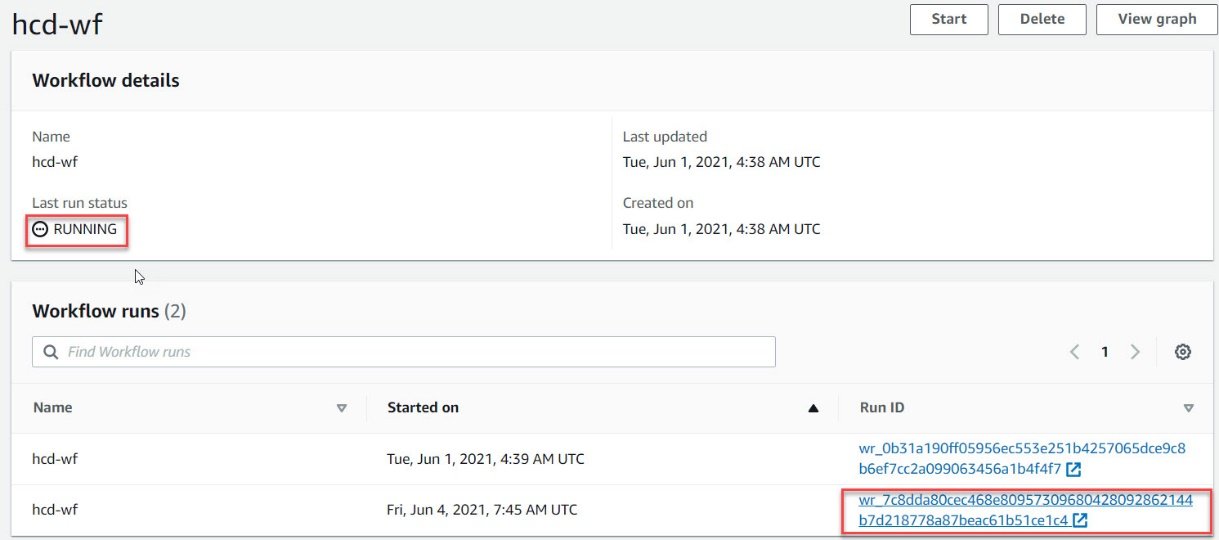
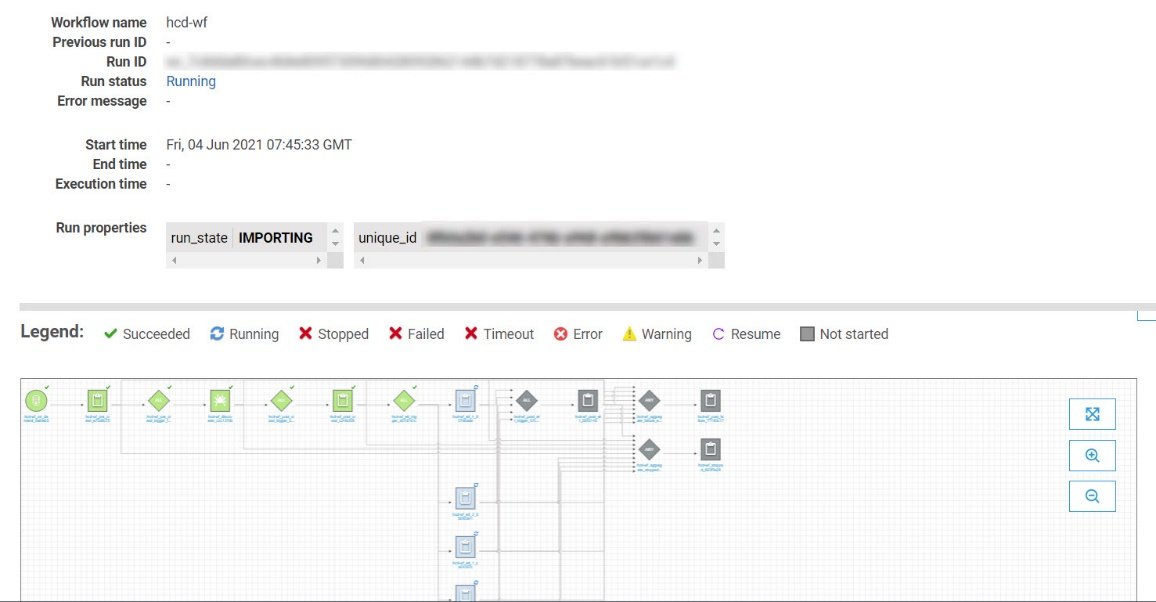
- Click on the “Run ID” to view the complete load plan and status.
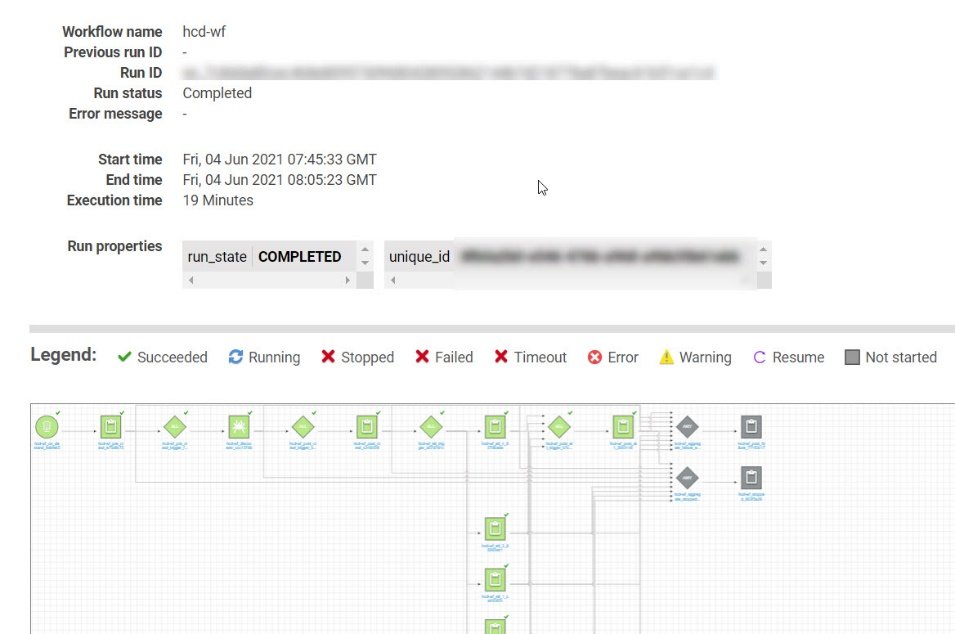
- Once the load is complete the load status changes to completed.
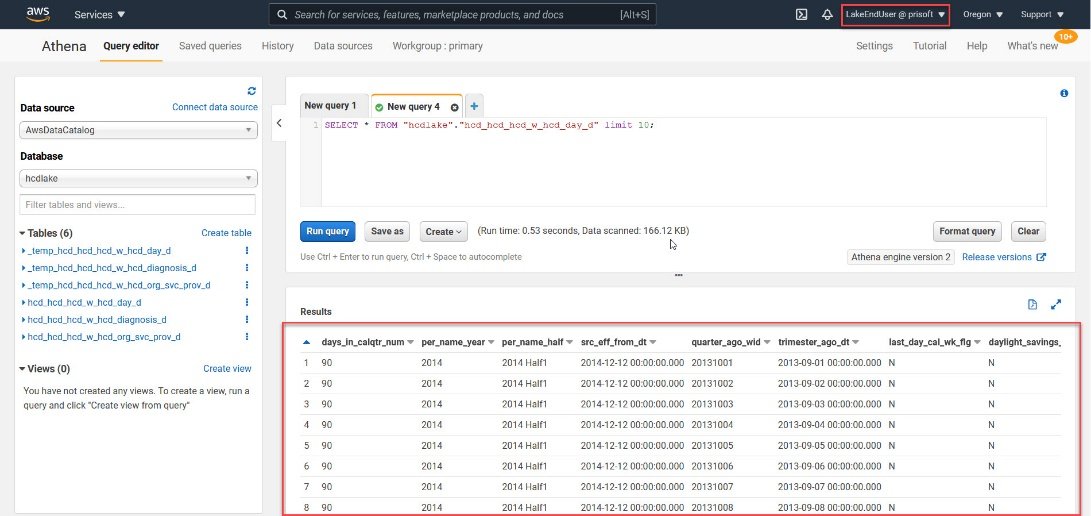
- To query the tables that we just loaded, navigate to Athena, Athena is a service that is used to query S3 in AWS.
- On the left pane connect to the lake database, you will see all the tables that we loaded along with sone temp tables.
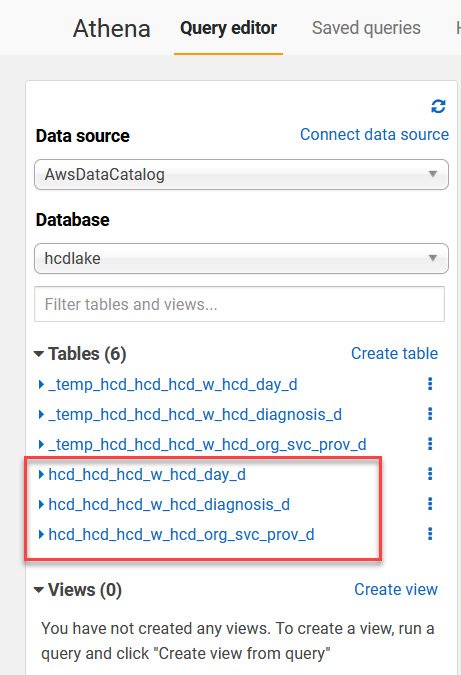
- We can query any of these tables using Athena.
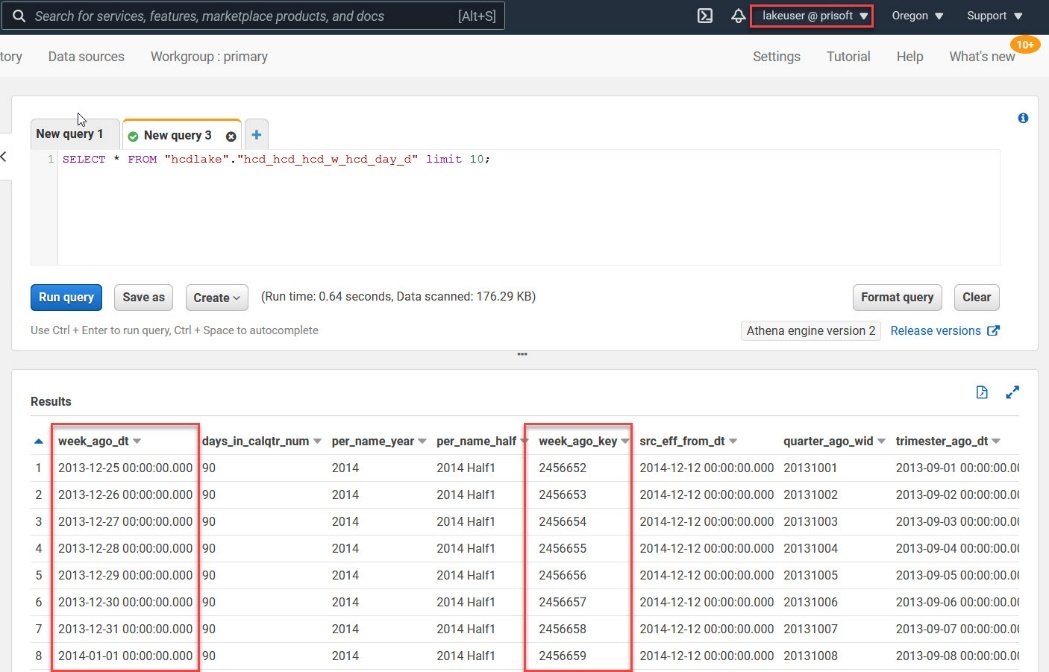
- In the next image, we have used a used called “lakeuser” that has full access to all the tables. Querying the tables using this user will show data for all columns.
Setting up Security
- Notice that I have highlighted 2 columns in the result window in the previous image. In next few steps we will see how to use the security feature available in data lake to hide these columns from a user.
- Here we have assumed that a user has already been created.
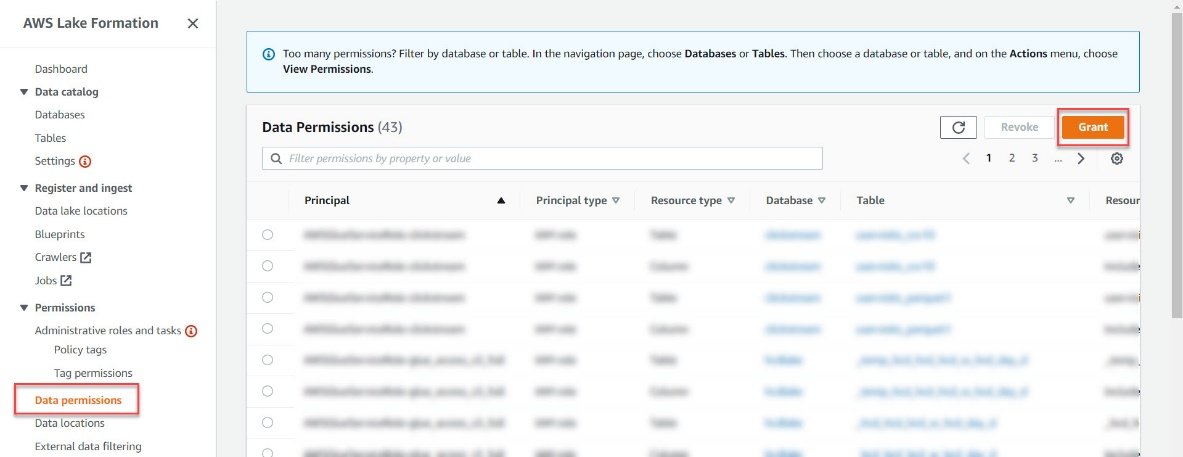
- Navigate to AWS Lake formation Console, click on “Data Permissions” in the left pane then click on “Grant”.
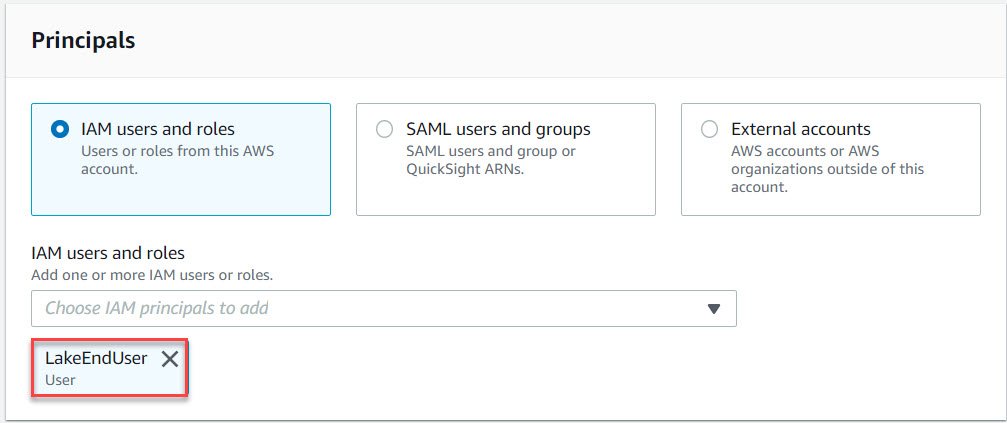
- In the Grant Permission page, In the principal section select the user that you want to provision from the dropdown list. Once the user is selected it should appear as shown below.
- In the next section, we will select the database we created previously and the table we want to provision.
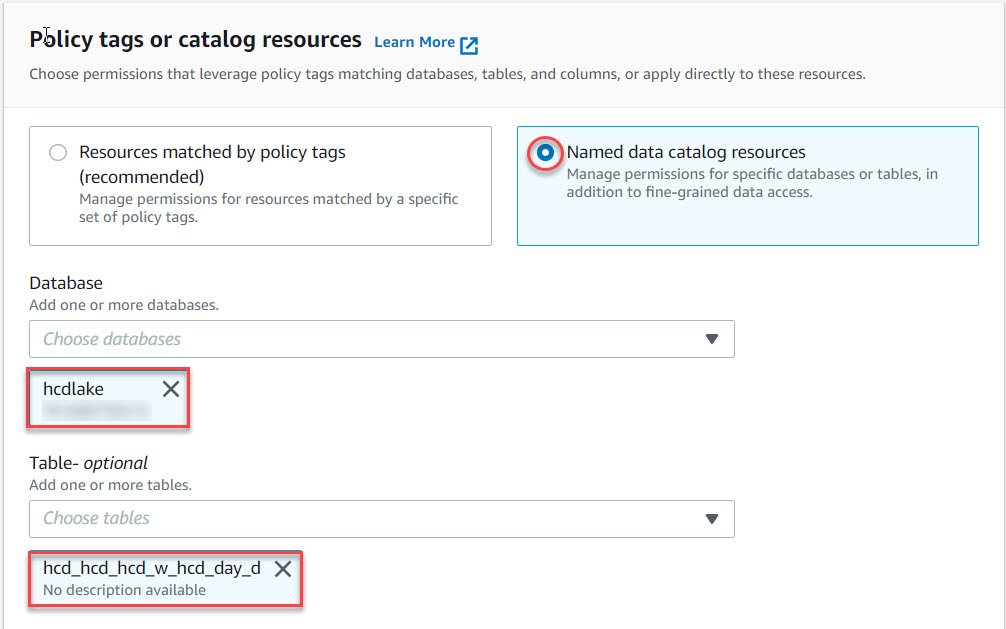
- In the permission section, we can either select table permission or columnar permission depending on our requirement. In this case we will select columnar permission.
- Select “Exclude Columns” to hide the columns from the user. Also, select the columns that you want to hide in the select column dropdown list.
- Once all these fields are filled click on “Grant”.
- You should receive a message of “Grant Successful”.
- Login using the user that you just provisioned.
- Navigate to Athena and run a select statement to see all the available columns.
- We will see that the columns that we excluded for the users are not available.
About Prisoft
Prisoft has decades of experience in implementing on premise data warehouse solutions around Oracle, Teradata and Microsoft SQL Server technology stack. On our legacy projects we had mainly used Oracle Answers, PowerBI, Tableau and Qlik as the visualization tools. In the evolution process from Oracle to Teradata we are now witnessing a third wave of innovation in data warehousing technology with the advent of cloud data warehouses. As enterprises move to the cloud, they are abandoning their legacy on premise data warehousing technologies, including Hadoop, for these new cloud data platforms. This transformation is a huge tectonic shift in data management and has profound implications for enterprises.