Introduction:
Despite its popularity, Tableau isn’t the only tool that data scientists are using today. Data science is a massive field with many areas, so analytics teams often use several tools together for data science purposes.
For example, Tableau can be used in conjunction with programs like MATLAB for predictive analytics, Alteryx for data blending, Datameer Spotlight for finding, accessing, and combining data sources, and Anaconda for data discovery and analysis, among many other tools. In this I am using the Anaconda for the Tabpy connection.
Preparing Tableau Prep to work with python:
Python is a general-purpose programming language ranking as one of the most popular languages right now. To find more about python, visit https://www.python.org/.
In order to allow Tableau Prep to communicate with python, you need to prepare your machine with a Tableau Python server known as TabPy. To start the TabPy server you need to install Python or you can download Anaconda. Here I am using Anaconda, to install the Anaconda visit https://www.anaconda.com/products/individual then a browser will open and then click download as shown in below screenshot.

After the download is completed, install it in your desktop. It’s very easy to install, just accept all the license and just click next. Once it is installed go to the Windows menu and search for Anaconda Command prompt and run it as administrator.
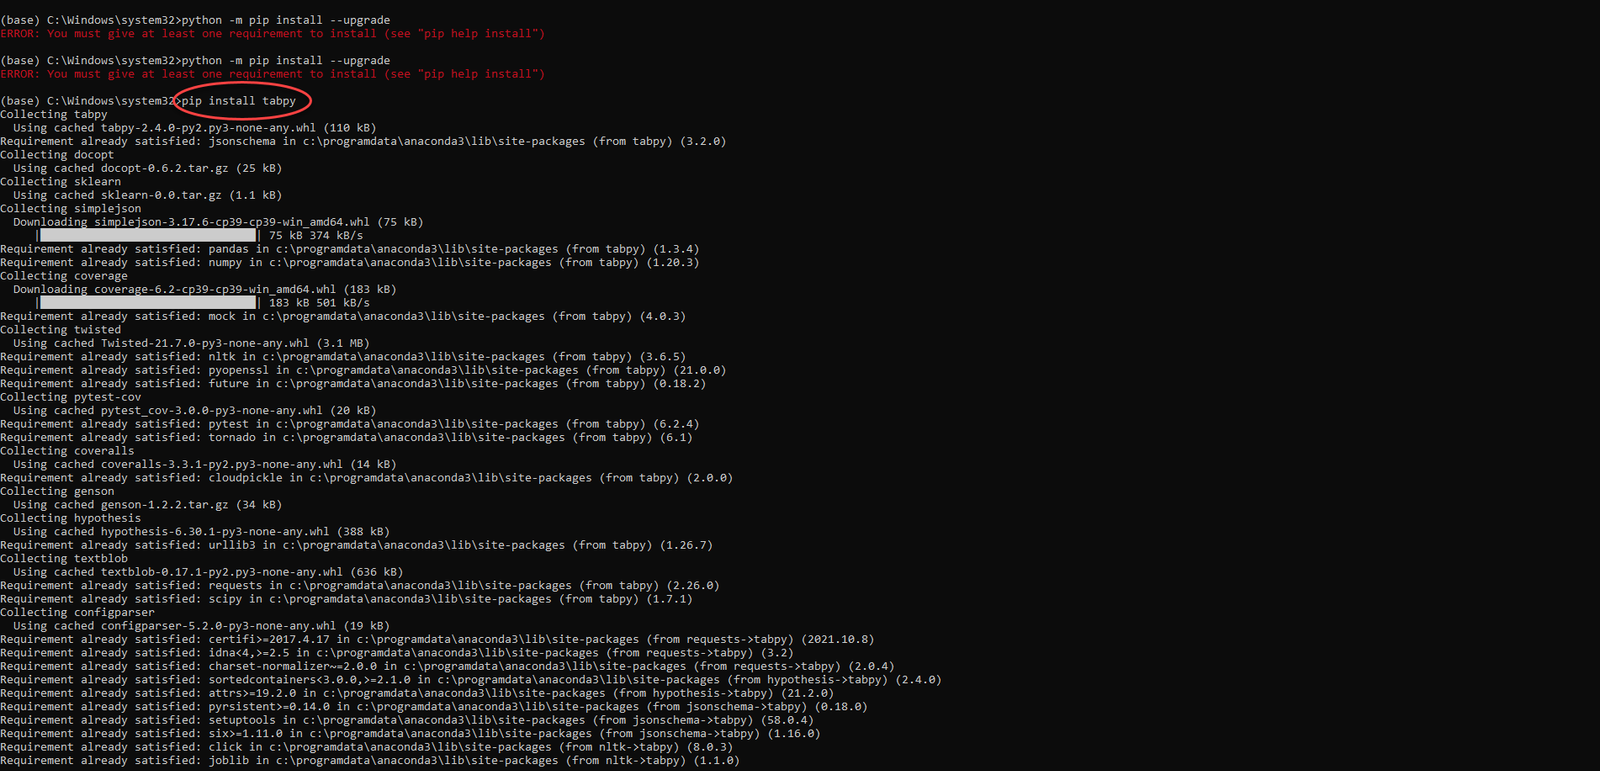
If you are using a little older version of Anaconda then just upgrade the pip by typing the command python -m pip install –upgrade in the anaconda command prompt. It will upgrade the pip. Now we will install the Tabpy server, to install the TabPy server run the command in the anaconda command prompt pip install TabPy after type this it will install a TabPy server as shown below.
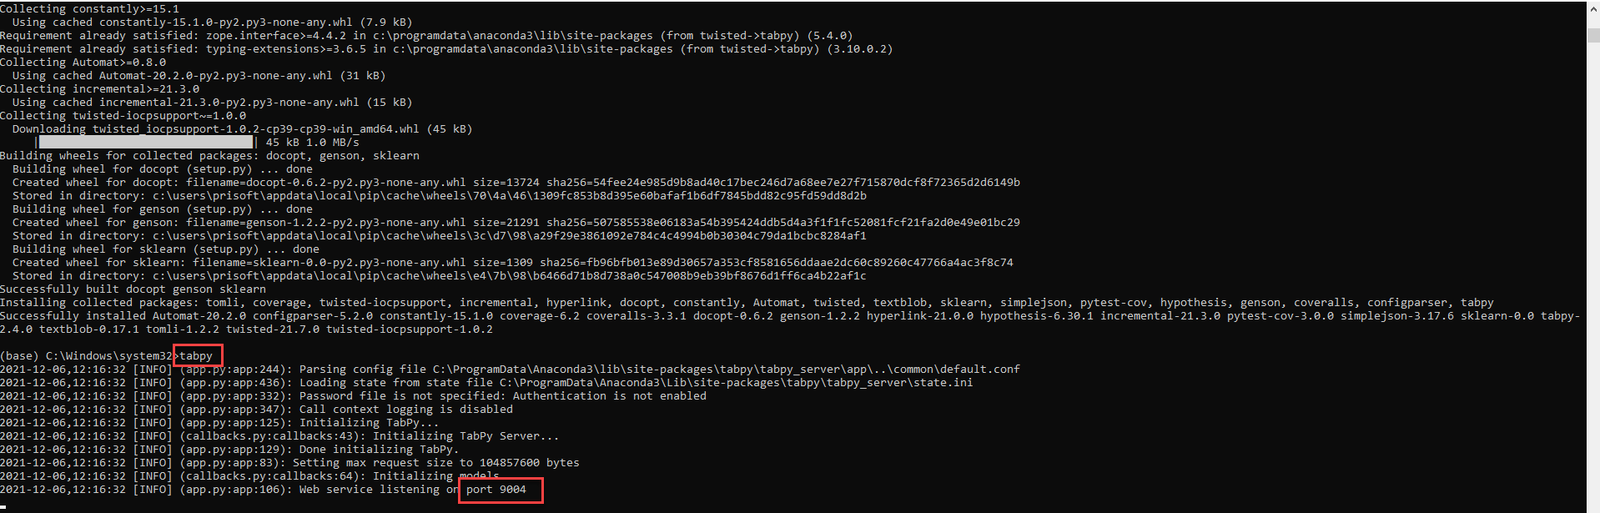
Now run the command TabPy in the anaconda command Prompt, it will open the TabPy server and port with default port no 9004 as shown below.
Now you can connect Tableau Prep with the TabPy server let’s start it.
Embedding Python code in a Tableau Prep flow:
- In the Tableau Prep Builder go to the Help section which is in the left top menu bar then go to the setting and performance section then select manage Analytics extension connection.
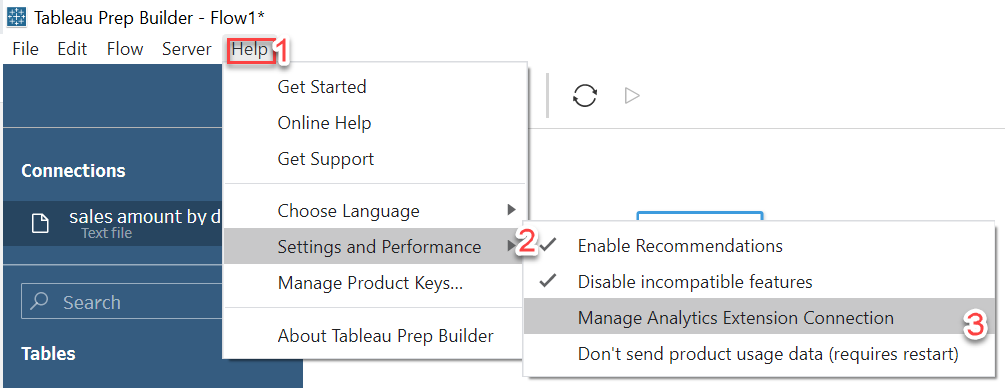
- Set the server’s name to localhost and the port to 9004 and click sign to save the configuration, Follow the below mentioned screenshots:


First, you have to download all the codes from the below GitHub link https://github.com/PacktPublishing/Tableau-Prep-Cookbook and save the zip file at your suitable location and extract those.
In Tableau Prep import the sales by date .csv which is in the chapter 08\Sample Files 8.5 – Embedding Python code in a Tableau Prep Flow folder which is in the recently extracted folder.
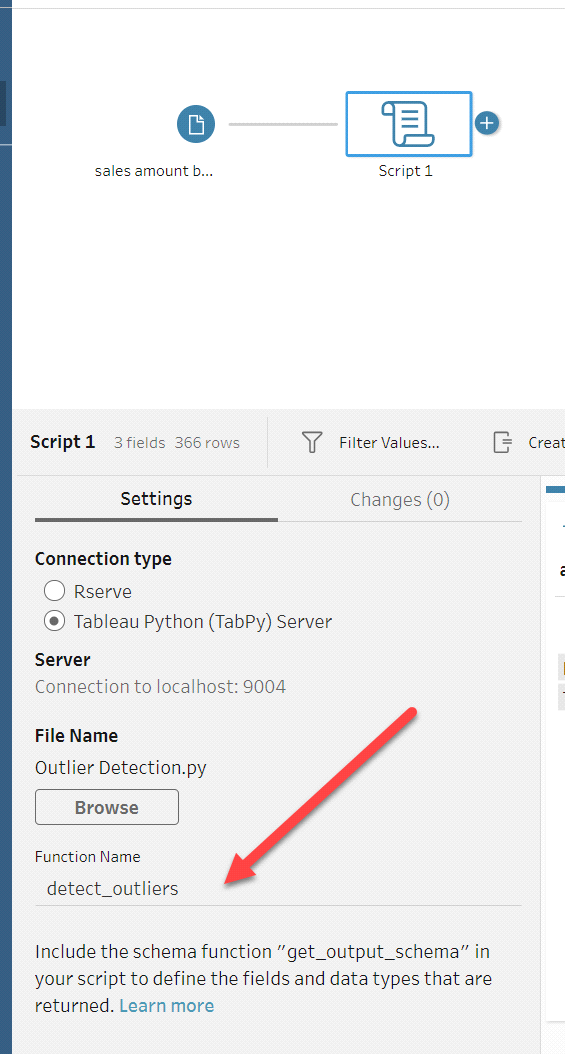
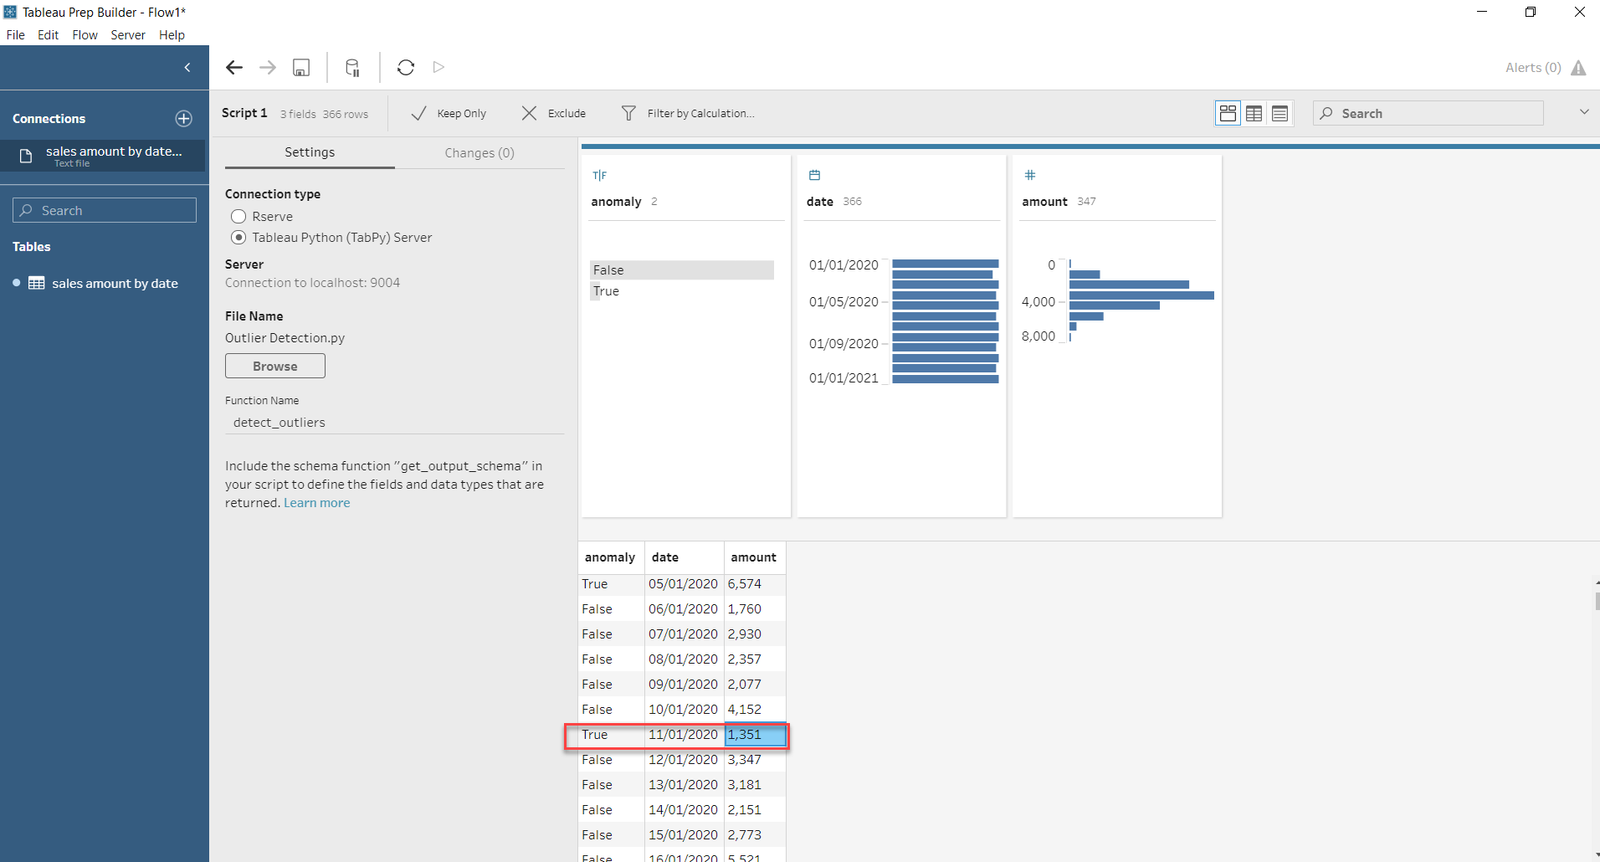
After importing the .csv file then add script node by clicking the (+) icon which is next to the sales amount by date node and select script and configure it. Look at the below screenshot.
- To configure it in the setting pane, select Tableau Python (TabPy) Server.
- In the Filename browse the .py file from that folder from where you have imported the .csv file.
- Function name should be as per user given function name which you can see in the TabPy server after importing the .csv file. You can see the function name as below
- Once the .csv file is imported you will see the whole python script in the TabPy server as shown below
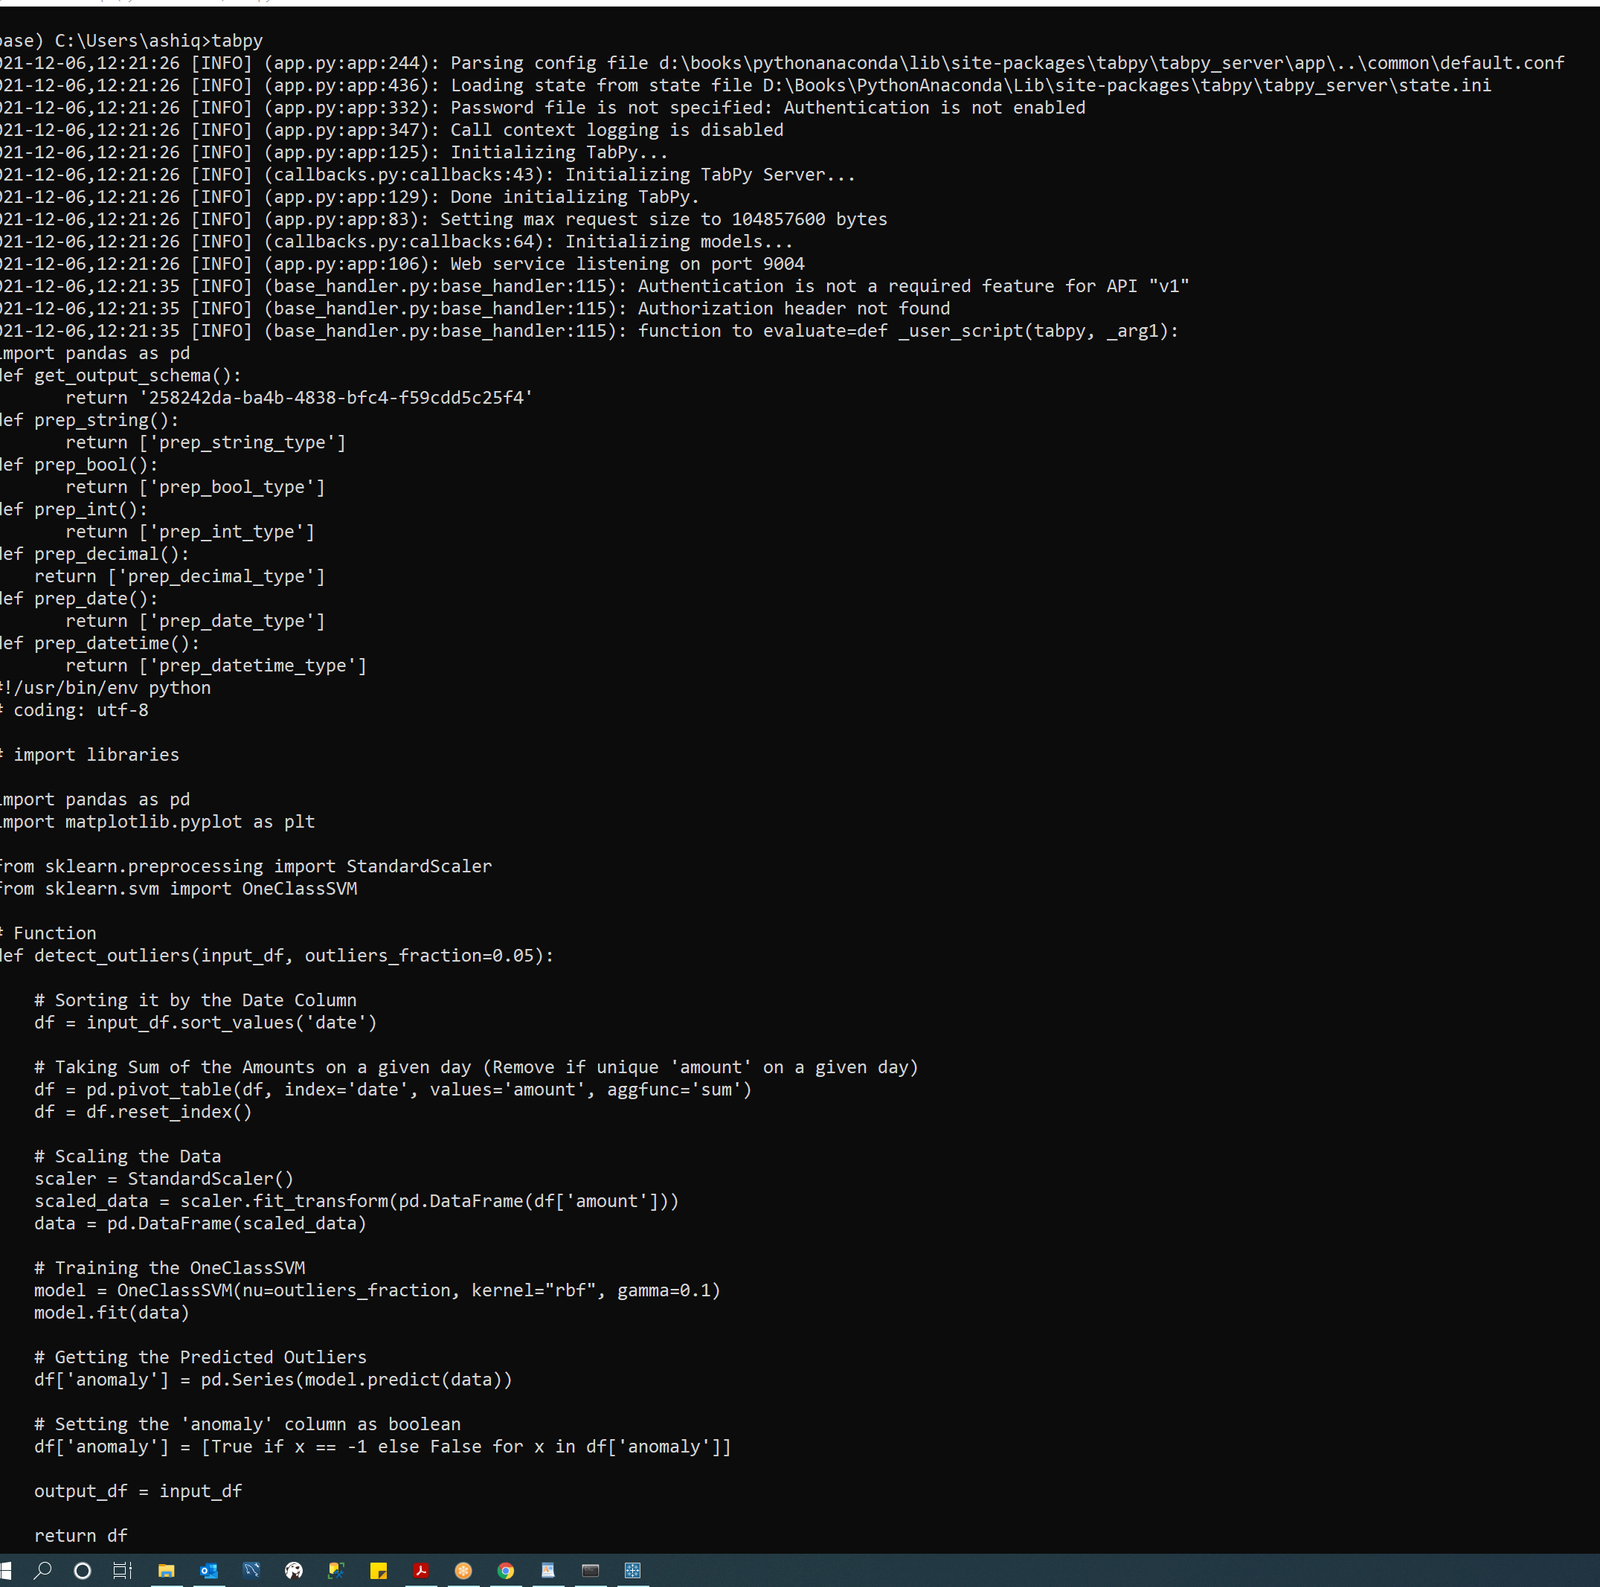
- You can see the function name in the above Screenshot which is detect outliers. Put this name as function name.
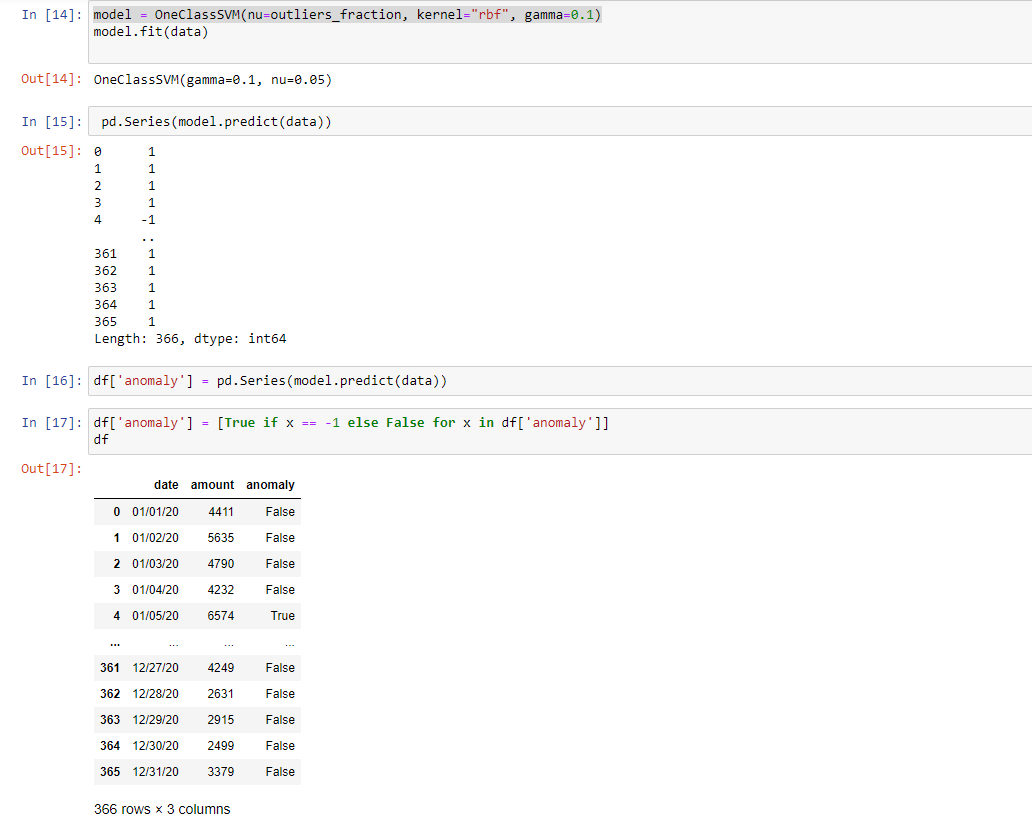
- By this script we will detect all the outliers. When you add this script, you will see a newly added column named anomaly containing True/False in the result set of the Tableau Prep.
- It’s detecting the anomaly which are equal to -1 that will be treated as True otherwise that is false. In the results, you will observe that 11/01/2020 has been flagged as an anomaly and its value is 1351 that make sense as its neighboring values are significantly higher.
Code Analysis:
Diving into the code using Jupyter Notebook we can get the clarity of what is happening in the code part.
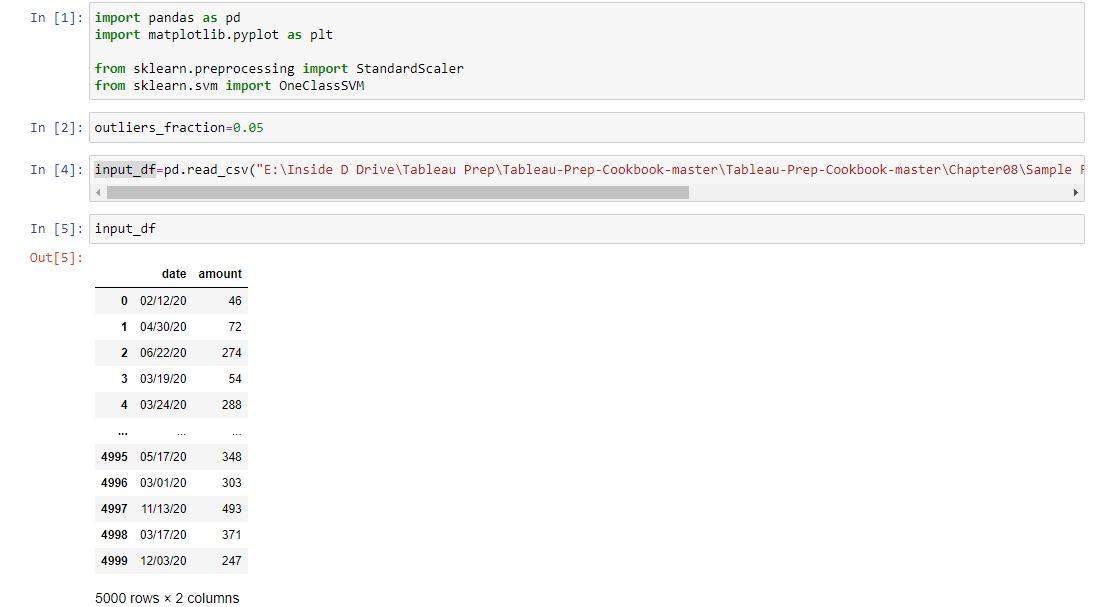
- 1st in this segment we can see the input values that is in the csv file. It has 2 columns with 5000 set of data in date and amount columns.
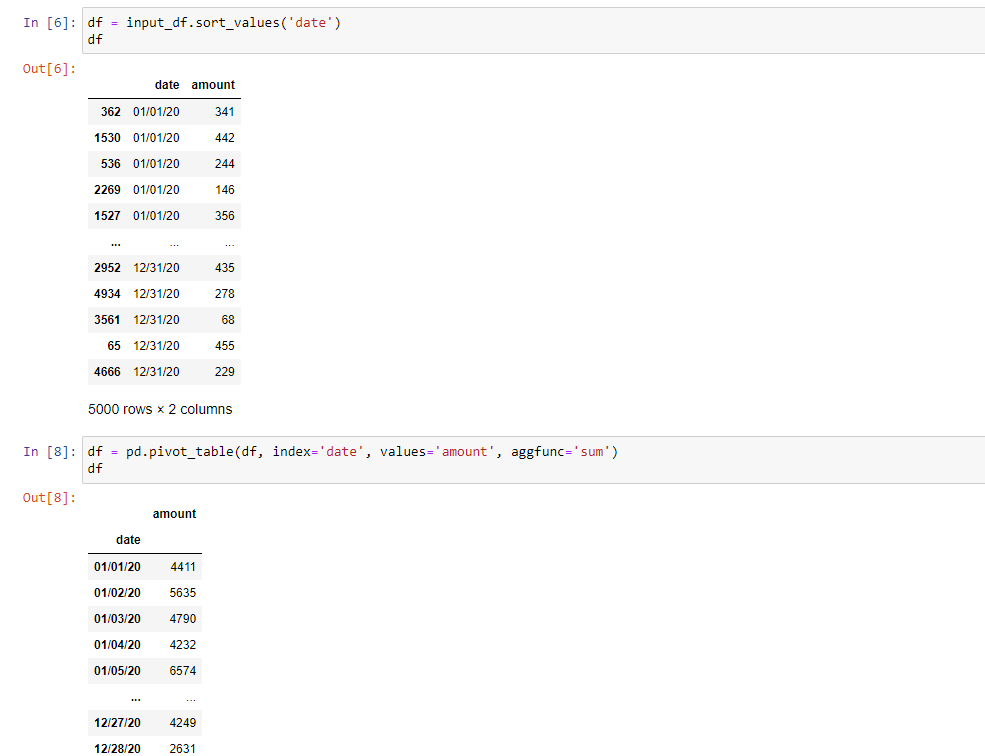
- Next, we sort the column based on date and then we aggregate the sum of amount based on the dates. Till this it comes as a basic step to understand the complete code. From here on it gets a bit complicated. Now we can create an index column to know the number of rows formed after aggregation. Following that, we set the amount data into a scalar form in a Data Frame (similar to table).

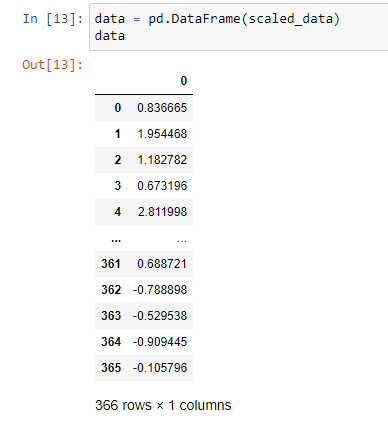
- Let’s check the data after Data Framing scaled data.
- Now comes the final part where the data is modelled using Unsupervised Machine Learning. This implementation is based on libsvm (Library for Support Vector Machines).This part is complex because it uses parameters kernel and gamma. To understand this concept we need to refer to few sources. Some of those are attached for further deep-diving.
- Since we are covering the basics lets stick to it. The final result is shown in the screenshot.
Conclusion:
The purpose of this exercise is to predict the anomaly based on Unsupervised Machine Learning using Python. This concept is covered in Machine Learning and is used mostly by Data Scientists for their prediction. Since we are using this for TabPy we are not Deep-diving into Data Modelling using Unsupervised Learning.
Finally, the anomaly is stored as T/F and we get the results as needed. Tableau Prep shows the result as shown in the following screenshot.
Excellent Work!!!!!